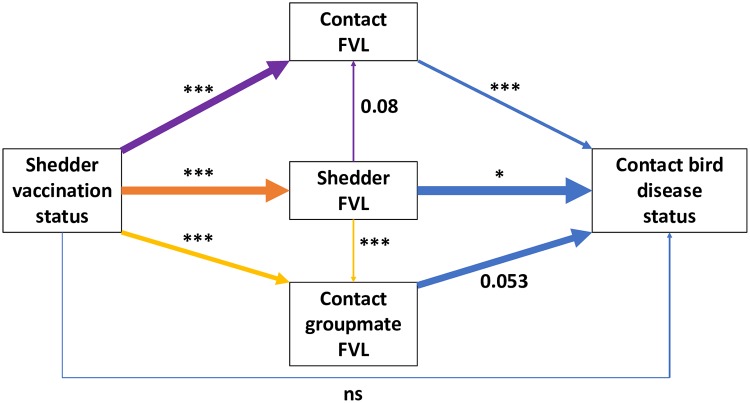
Fig 5. Diagrammatic representation of the mediating effects of viral load on contact bird binary disease status.
Each arrow colour represents a different multiple regression analysis, with arrows pointing from predictors to response. Arrow thickness represents regression coefficient (all significant or marginal relationships were positive). The diagram shows that the effect of shedder FVL on contact FVL (see Table 2) fails to fully explain the shedder vaccination effect, which remains significant when both variables are included (purple arrows). The same is true for the cumulative FVL of all infected groupmates (yellow arrows). However, the 3 FVL predictor variables together completely remove the effect of shedder vaccination status (blue arrows) in explaining contact disease status (see Table 1), and this is true for all other contact disease variables (S1 Table). This implies that shedder vaccination effects on contacts are fully mediated by FVL of infected individuals in a contact group. Significance is indicated by asterisks: ***p < 0.001, **p < 0.01, *p < 0.05, ns = not significant. Marginally nonsignificant p-values are presented numerically. All results presented here are from models excluding the DPI by vaccination status interaction but including sex and DPI main effects (not shown, see S1 Table). Underlying data are in Edinburgh DataShare repository (https://doi.org/10.7488/ds/2725). DPI, days post-infection; FVL, feather viral load.

