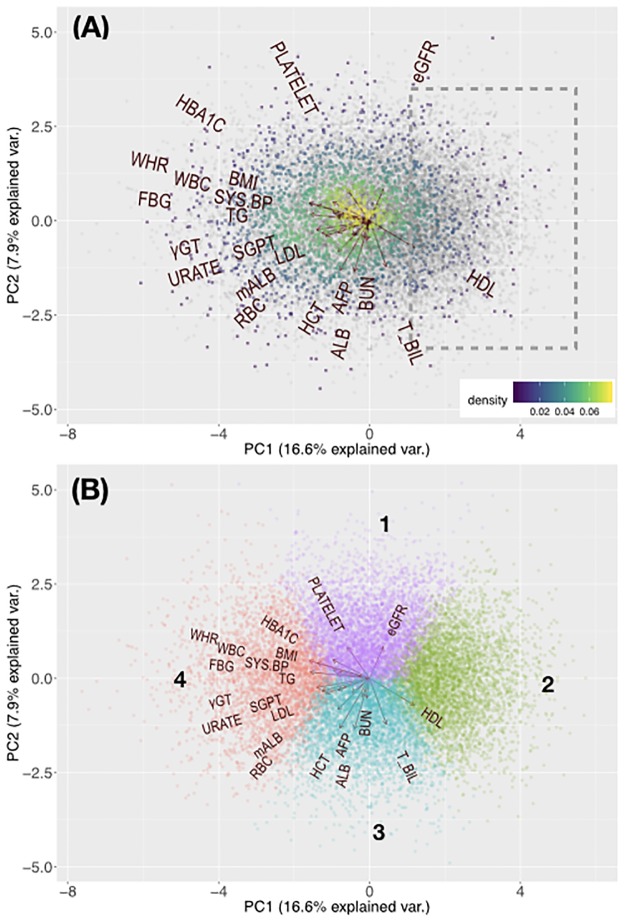
Fig 1. Principal component analysis of study subjects.
(A) Biplot of study subjects based on anthropometric and clinical biochemistry data. Each dot represents an individual. Disease-free individuals are colored in grey and self-reported disease cases are denoted with gradient colors, which reflect dot density. The dot density was calculated by splitting the plot into a 500 × 500 grid of squares and counting the number of dots per each square. Warmer colors represent higher densities of individuals. Trait vectors are also shown. The dashed bounded box represents a region of individuals with low disease prevalence. Biplots for individual diseases are available in S4 Fig. (B) Clustering results mapped on the PCA biplot. Trait vectors and assigned cluster numbers are shown. eGFR: estimated glomerular filtration rate; PLATELET: platelet count; HBA1C: serum glycated hemoglobin concentration; WHR: waist-to-hip ratio; BMI: body mass index; WBC: white blood cell count; FBG: serum fasting blood glucose concentration; SYS.BP: systolic blood pressure; TG: serum triglyceride concentration; γGT: serum γ-glutamyltransferase concentration; SGPT: serum glutamic-pyruvic transaminase concentration; URATE: serum uric acid concentration; LDL: serum low-density lipoprotein cholesterol concentration; mALB: urine microalbumin concentration; RBC: red blood cell count; HCT: hematocrit; AFP: serum α-fetoprotein concentration; ALB: serum albumin concentration; BUN: blood urea nitrogen concentration; T_BIL: serum total bilirubin concentration; HDL: serum high-density lipoprotein cholesterol concentration.

