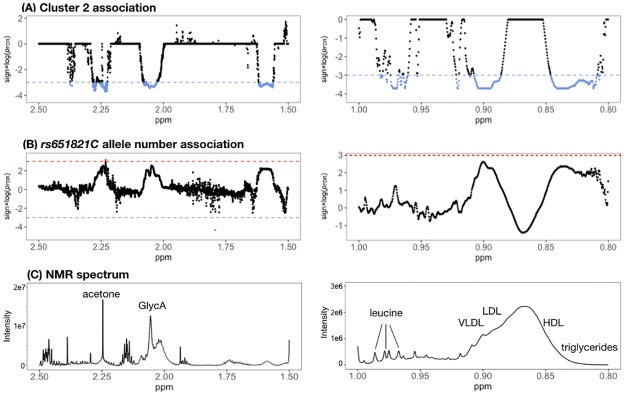
Fig 4. FDR plot of the NMR metabolome association with Cluster 2 (A) and number of C alleles of rs651821 (B).
Red and blue horizontal lines represent the threshold for statistical significance in terms of up- or down-regulation of metabolite levels, respectively. For reference, a representative NMR spectrum (including metabolite assignments) is shown in (C).

