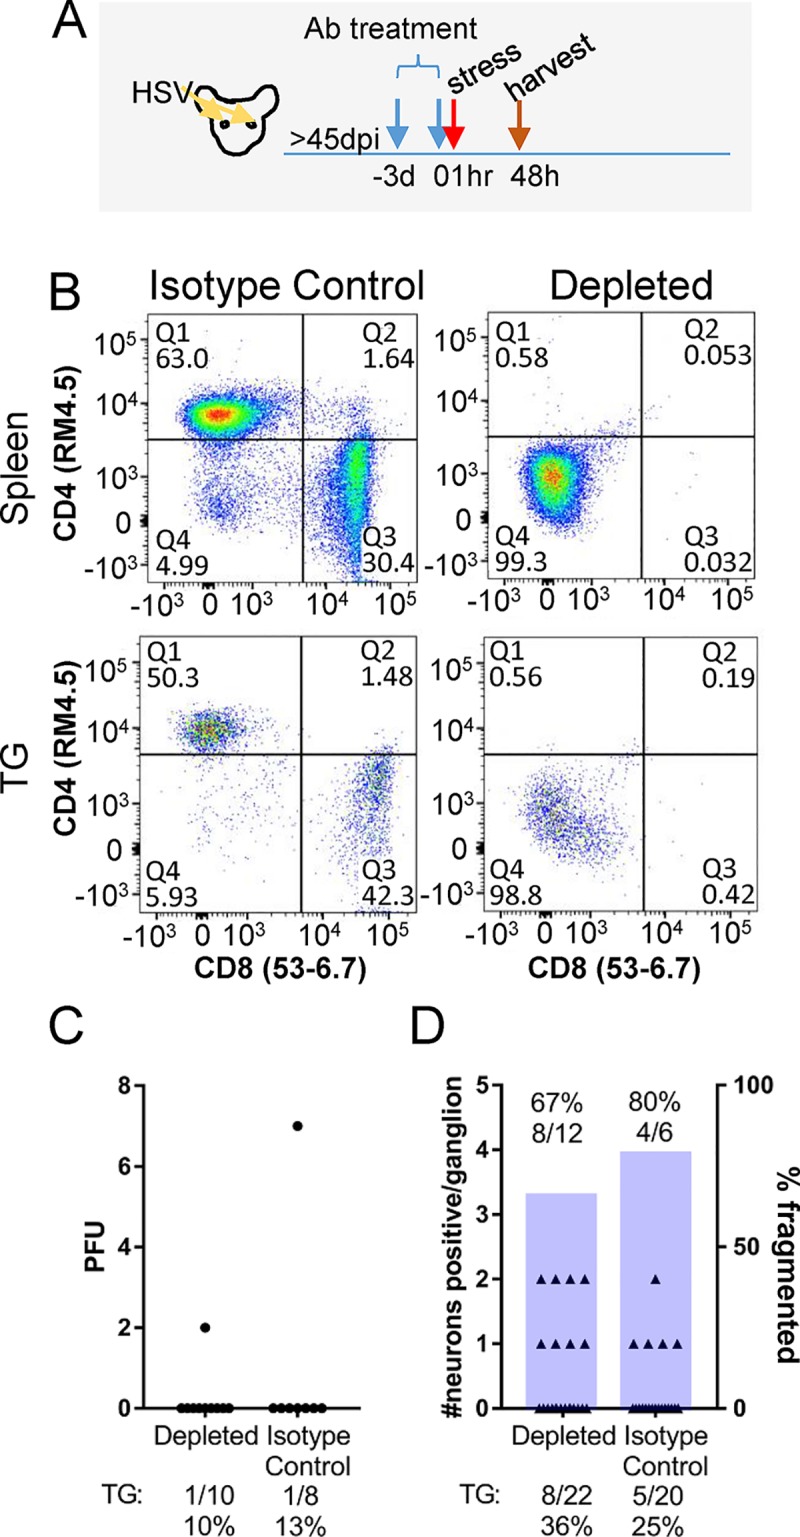
Fig 7. T cell depletion prior to induced reactivation.

Mice latently infected with HSV-1 17syn+ were treated with depleting antibodies 3 days prior to hyperthermic stress and given a second dose 1 h prior to hyperthermic stress, as described in Methods. Tissues were harvested at 48 h phs. (A) Schematic representation of experimental approach. (B) Depletion of CD4 and CD8 was confirmed by flow cytometry of the spleen and TG. (C) Infectious virus recovered in TG from depleted and control mice (Student’s t-test; p = 0.41). The percent reactivation (number of TG positive/total TG evaluated) is given below the graph. (D) The number of HSV positive neurons per ganglion in depleted and control mice are plotted on the left y-axis (Fisher’s Exact test; p = 0.51) and the percent exit from latency (number of TG positive/total TG evaluated) is given below the graph. The number of fragmented neurons out of total HSV positive neurons are represented as a bar corresponding to the right y-axis (Fisher’s Exact test; p> 0.99) and the absolute number is given above each bar.
