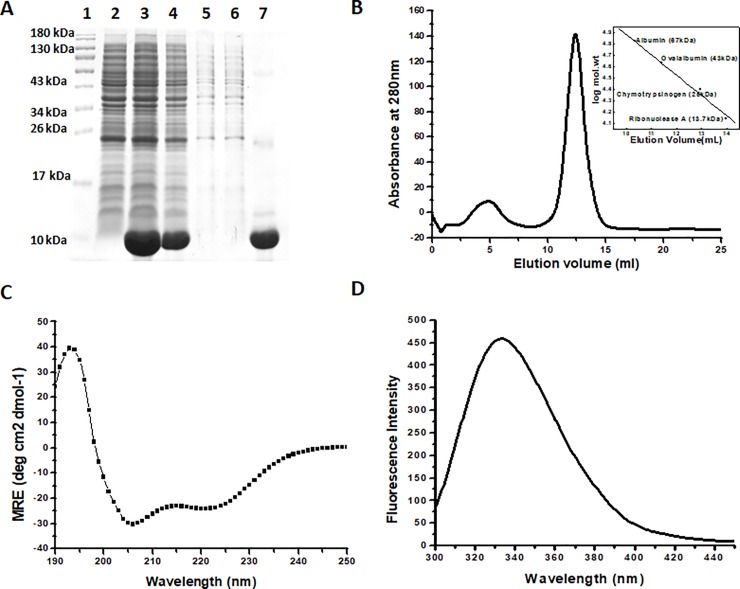
Fig 2. Purification and structural characterization of Sus1.
(A) Denaturing gel representing the protein sample at different stages of the purification. Lane 1 represents the protein marker while 2,3,4,5,6,7 represent the uninduced cell lysate, induced cell lysate, soluble fraction of the cell lysate, washing fraction 1 (washing with equilibration buffer with 20 mM imidazole), washing fraction 2 (washing with equilibration buffer with 50 mM imidazole) and elution fraction (elution with equilibration buffer with 300 mM imidazole) respectively. (B) AKTA profile of purification of the Sus1 elution fraction 3 using SuperdexTM 75, 10/300GL column. Inset represents the standard plot between the log mol. weight and elution volume. The proteins taken to plot standard graph are 67KDa (Albumin), 43KDa (Ovaalbumin), 25KDa (Chymotrypsinogen) and 13.70KDa (Ribonuclease A). (C) CD spectra of the native protein represent two minima at 208 nm and 222 nm. (D) Fluorescence spectra of native protein.

