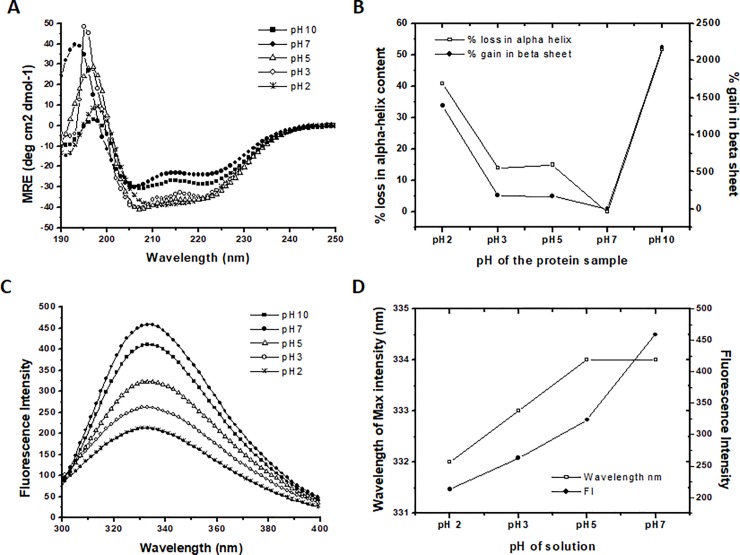
Fig 3. pH-dependent structural transition of Sus1.
(A) Represent far-UV CD spectra, (B) represent the % loss of α-helix and % gain in β-sheets (C) represents the fluorescence emission spectrum and (D) represent the plot of fluorescence intensity and wavelength of maximum intensity at different pH. Native protein (pH-7) represented by closed circle (●) followed by protein samples at pH-2, 3, 5 and 10 represented by star (⁎), open circle (○), open triangle (Δ) and filled square (■) respectively. % loss of α-helix is represented by open square (□) and % gain in β-sheets are represented by closed circle (●). Similarly, the wavelength of maximum intensity and fluorescence intensity is represented by open square (□) and closed circle (●) respectively. The % α-helix and β-sheets were calculated using the K2D3 web server.

