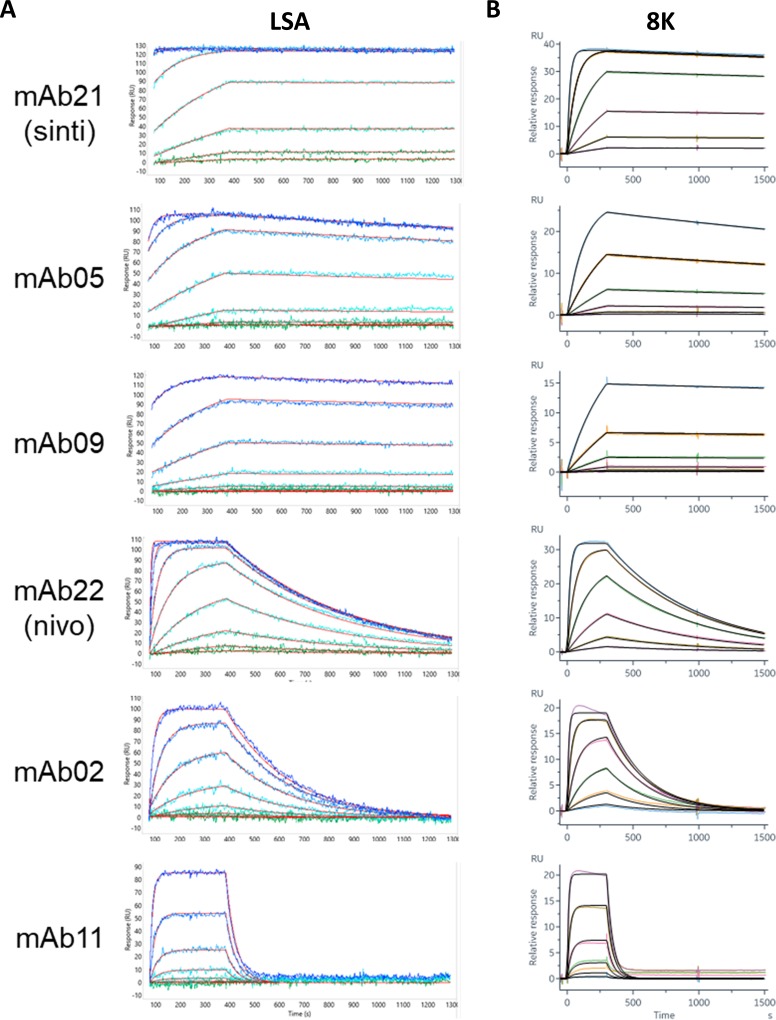
Fig 1. SPR capture kinetics on a CMD-P (flat) chip.
(A) Examples of data from six individual spots on the LSA, representing mAbs with diverse binding kinetics. Each panel shows an overlay plot of the measured responses, as a color gradient, from green to blue, representing ascending analyte (PD-1) concentrations from 0.5 nM– 1000 nM with the global fit in red. (B) Corresponding sensorgrams collected with the Biacore 8K with analyte concentrations from 0.41 nM– 100 nM (color gradient) for mAb05, mAb09, mAb21 and mAb22; 4.1 nM– 1000 nM (color gradient) for mAb02 and mAb11. Global fits are shown in black.

