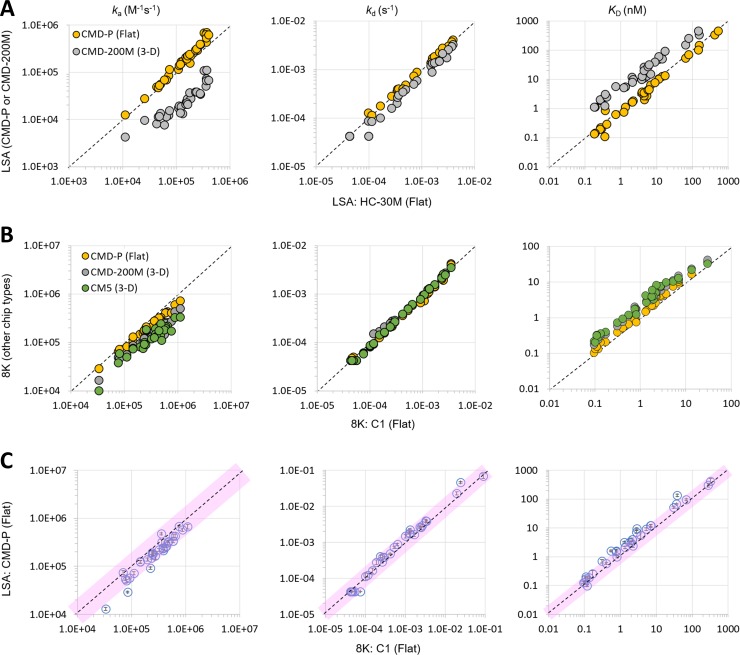
Fig 2. Exploring the effect of chip type on the apparent kinetic rate and affinity constants produced by the LSA and 8K instruments.
(A) Scatter plots reporting the mean ka, kd, and KD values for LSA data produced on different chip types, HC-30M (X axis) compared with CMD-P (orange) and CMD-200M (grey). The mean values were calculated from 8–12 measurements (spots) per mAb. (B) Scatter plots reporting single measurements of ka, kd, and KD for Biacore 8K data produced on different chip types, C1 (X axis) compared with CMD-P (orange), CM5 (green) and CMD-200M (grey). (C) Benchmarking LSA-CMD-P data against Biacore 8K-C1 data, where the LSA data represent the mean (symbol) ± stdev (Y-axis error bars) for 8–12 replicate measurements (spots) per mAb. In each plot, a perfect correlation is indicated by the dashed diagonal line. The pink shaded areas define a two-fold deviation from perfect correlation. Panels A and C show data for 33 mAbs, whereas panel B shows data for 29 mAbs. Extreme outliers or data with poor fits to a 1:1 biding model were excluded.

