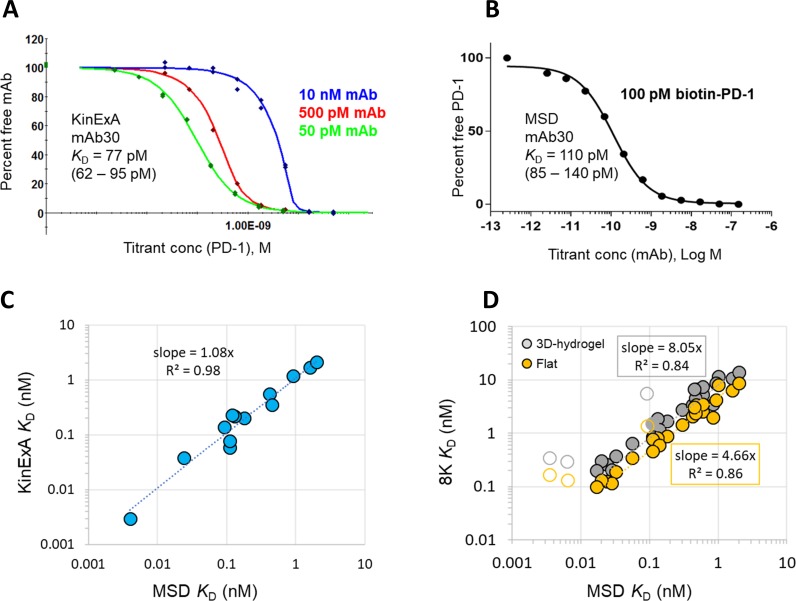
Fig 3. Solution affinities via KinExA and MSD.
Representative solution affinity curves for mAb30 via (A) KinExA (n-curve analysis) and (B) MSD (single curve analysis). (C) Correlation between KinExA (Y-axis) and MSD (X-axis) for 13 mAbs. (D) Correlation between SPR (Y-axis, average KD for Biacore 8K) for 27 mAbs on 3D-hydrogel (CM5 and CMD200 chips, grey) or flat chip (C1 and CMD-P, orange) and MSD (X-axis). The slope of the trendlines indicate average deviation from a perfect correlation for each chip type. Data for antibodies (mAb09, mAb18 and mAb29) measured at the off-rate limit of detection (< 4.27 x 10⁻⁵ s-1) for the SPR experiments where the correlation does not conform are indicated with open circles, and not included in the trendline calculation. Data from mAb27 and mAb33 were excluded from this plot due to poor fits to a 1:1 binding model (see the associated S1 File).

