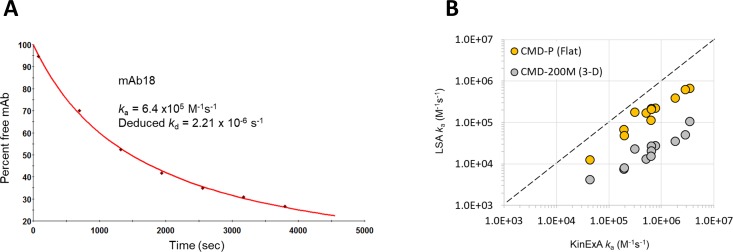
Fig 4. Benchmarking on-rates determined on different chip types using high-throughput SPR (LSA) versus solution phase measurements (KinExA).
(A) Example result from a KinExA on-rate experiment (mAb18). (B) Correlation plot showing the effect of chip type (flat or 3D-hydrogel) on the apparent on-rates determined by the LSA (Y-axis) benchmarked against solution values measured on the KinExA (X-axis).

