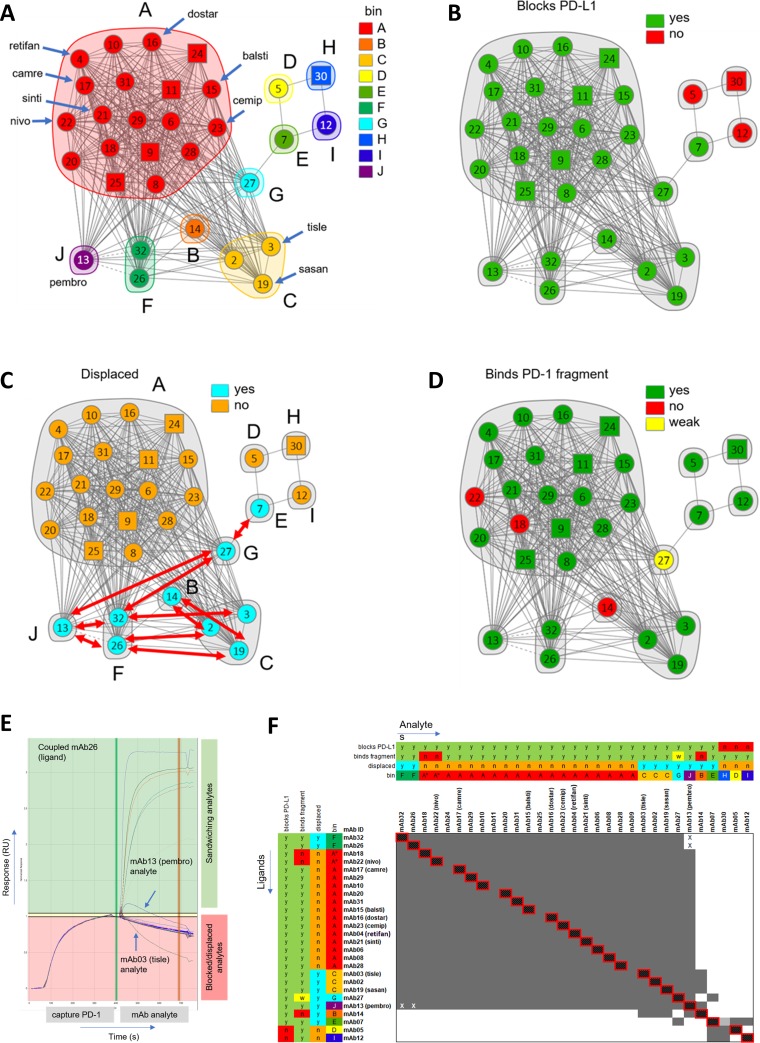
Fig 5. Network plots depicting the epitope clusters deduced from binning a panel of 31 anti-PD-1 mAbs.
Blocking relationships (cords) between mAbs (nodes) enable the clustering of mAbs into bins (inscribed by envelopes), where a bin represents a family of mAbs sharing an identical blocking profile when tested against all other mAbs in the test set. The plots are colored by (A) bin, (B) PD-L1 blockade (green = blocks, red = does not block), (C) displacement (cyan = yes, orange = no), where the red arrows indicate the observed displacements and (D) binding to P35-Q167 PD-1 fragment (green = binds, red = does not bind, yellow = binds fragment with weaker affinity than full-length PD-1). All mAbs were tested as both analyte and ligand (circular nodes) except five mAbs (09, 11, 24, 25, and 30) which were tested only as analyte (square nodes). (E) Sensorgram overlay plot depicting an example of displacement. In this example, analytes mAb13 (pembro) and mAb03 (tisle) each displace PD-1 from coupled mAb26, as judged by sandwiching curves that show decaying or inverted responses, respectively.[14] This implies that mAb03 and mAb13 each target epitopes that are closely adjacent to or minimally overlapping with that of mAb26. (F) Heat map merged with orthogonal data where grey represents a blocking relationship and white a sandwich (non-blocking). The cells marked with an X indicate an asymmetric block, i.e., an apparent block in only one direction of the heatmap (mAb13 vs mAb26 and mAb13 vs mAb32), due to the formation of a transient sandwiching complex observed in only one order of addition, consistent with a displacement.

