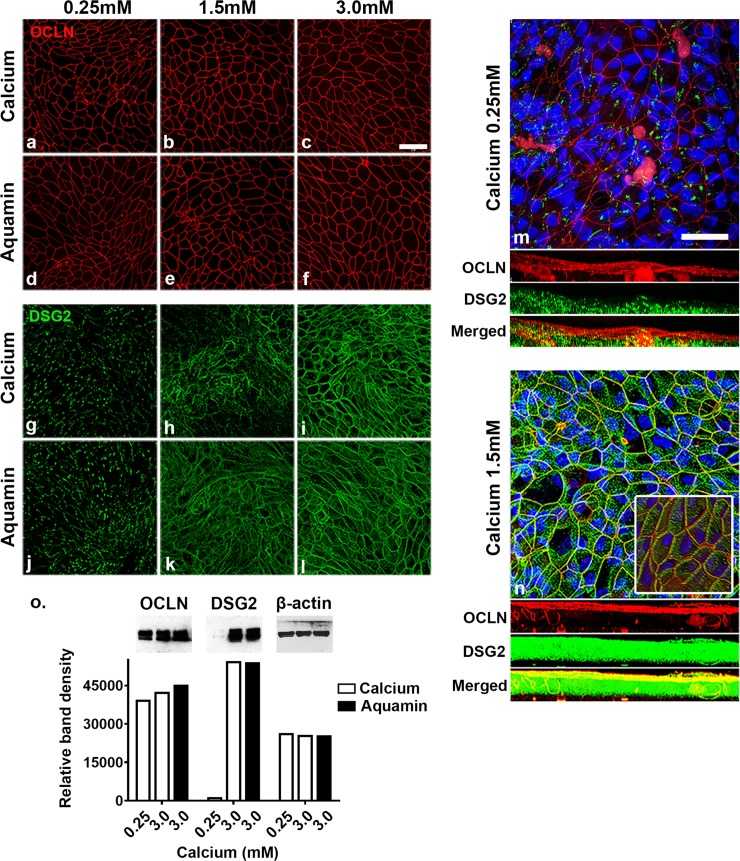
Fig 2. Confocal fluorescent microscopic images and western blot results at day-5.
Colonoids were plated on transwell membranes and incubated under the indicated conditions. After TEER assessment at day-5, membranes were prepared and stained. a-f: Occludin (max projected); g-l: Desmoglein-2 (max projected). m-n: Occludin and desmoglein-2 (z-stack composites made up of approximately 50 planes per image). Nuclear staining is indicated by blue color (DAPI). The three bands below the main images represent horizontal views of staining through the cell layer at each z-plane. Occludin is red, desmoglein-2 is green and the bright yellow color in the horizontal view of the 1.5 mM calcium image represents a composite of the two proteins. Inset: The inset in the 1.5 mM calcium image is a view of the entire z-stack viewed from a 45o angle to the cell surface in order to provide a 3-dimensional rendering. Scale bar = 10 μm. o: Western blot for occludin and desmoglein-2. 10 μg of protein from each condition was used. β-actin was used as a loading control. Band quantitation was done using ImageJ software. OCLN = occludin; DSG2 = desmoglein-2.

