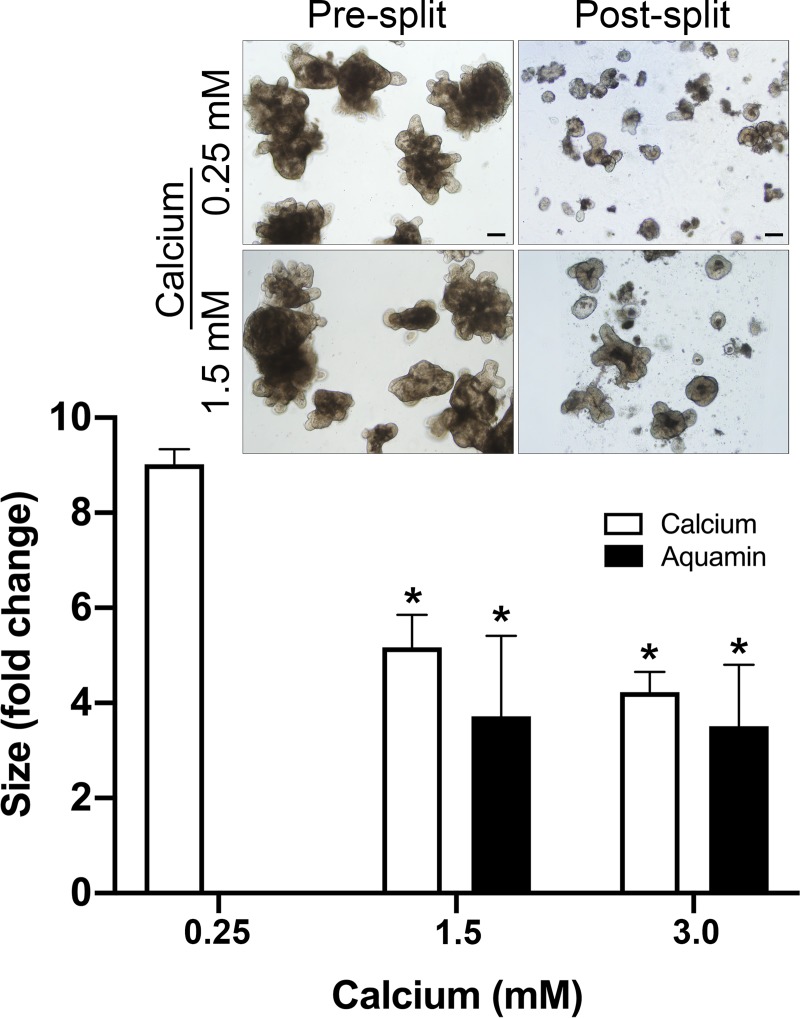
Fig 5. Colonoid cohesion.
Colonoids were maintained for 14 days in culture under the indicated conditions. At the end of the incubation period, the size of multiple individual colonoids was assessed by measuring surface area in phase-contrast images. Following this, the colonoids were harvested and fragmented for subculture. After plating, the fragmented colonoids were again “sized.” Values shown represent the change in surface area means and standard deviations of individual colonoids based on three separate experiments representing colonoids from three different subjects with a minimum of 80 colonoids from each subject assessed per treatment group in both pre- and post-split cultures. Data were compared for statistical differences using ANOVA followed by unpaired-group comparisons. * indicates a difference from 0.25 mM calcium at p<0.05. Inset: Representative examples of pre-split and post-split colonoids. Scale bar = 200 μm.

