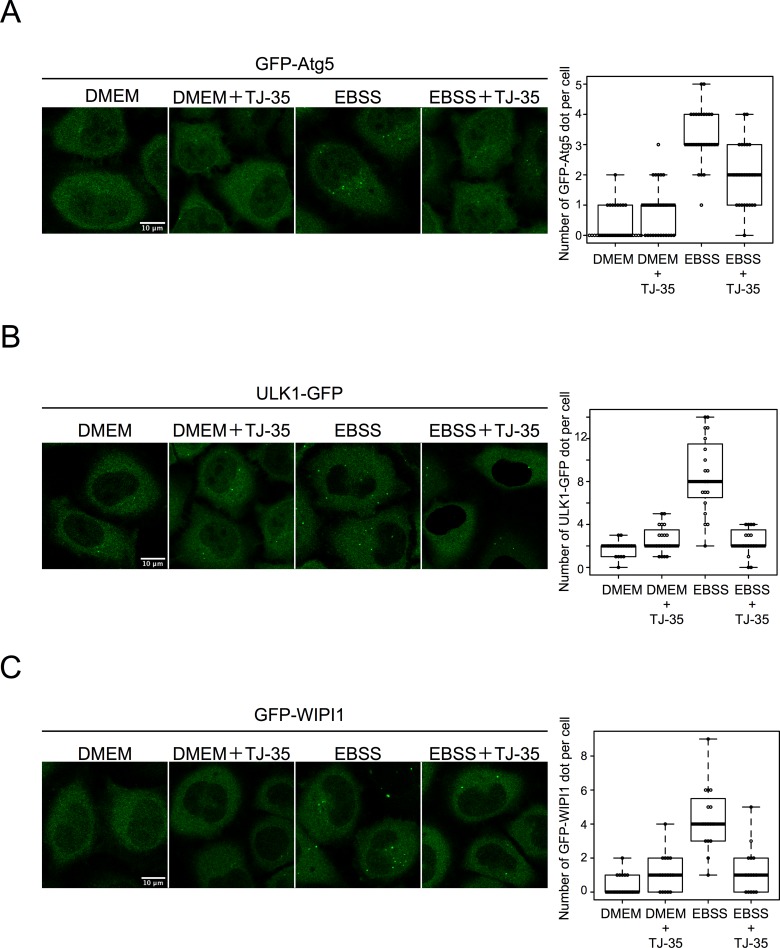
Fig 3. TJ-35 suppresses autophagosome formation under starvation condition.
A. GFP-Atg5 expressing HeLa was treated with or without TJ-35 for 4 h, and then shifted to DMEM or EBSS with or without TJ-35 for 2 h. The graph shows GFP-positive puncta per cell. Median: line; upper and lower quartiles: boxes; 1.5-interquartile range: whiskers. We counted 25 cells in three independent experiments. Bar represents 10 μm. B. ULK1-EGFP expressing HeLa was treated with or without TJ-35 for 4 h and shifted to DMEM or EBSS with or without TJ-35 for 2 h. The graph shows GFP-positive puncta per cell. Median: line; upper and lower quartiles: boxes; 1.5-interquartile range: whiskers. We counted 25 cells in three independent experiments. Bar represents 10 μm. C. GFP-WIPI1–expressing HeLa cells were treated with or without TJ-35 for 4 h and shifted to DMEM or EBSS with or without TJ-35 for 2 h. The graph shows GFP-positive puncta per cell. Median: line; upper and lower quartiles: boxes; 1.5-interquartile range: whiskers. We counted 15 cells in three independent experiments. Bar represents 10 μm. * denotes p<0.05 (unpaired two-tailed Student’s t-test) between EBSS and EBSS plus TJ-35.

