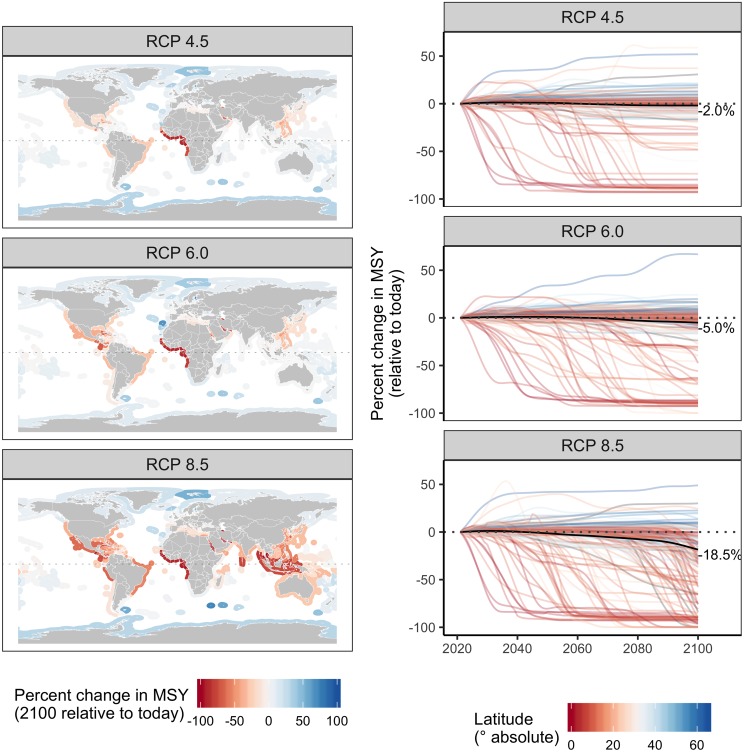
Fig 1. Percent change in maximum sustainable yield (MSY) under each emission scenario.
In the left column, maps show the percent change in MSY from 2012–2021 (“today”) to 2091–2100 in each exclusive economic zone. In the right column, the colored lines show the percent change in MSY (measured in 10-year running averages) relative to 2012–2021 (“today”) for each of 156 countries and the black lines show the percent change globally.

