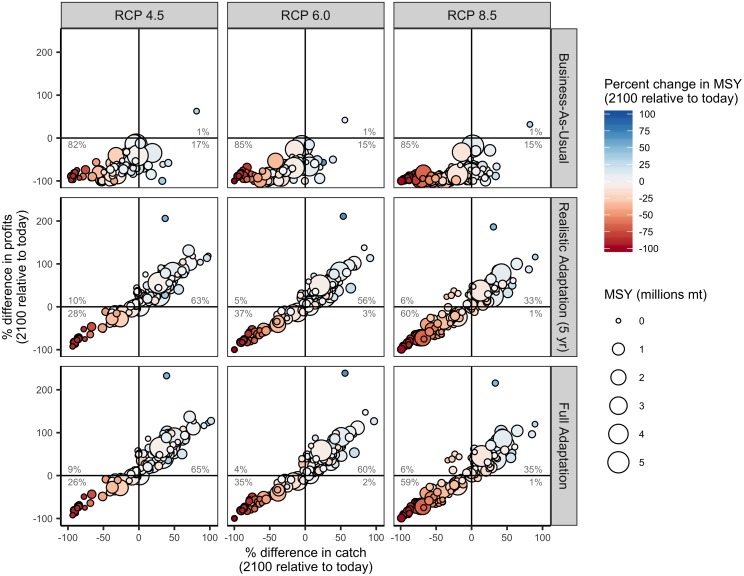
Fig 3. Percent difference in mean catch and profits in 2091–2100 relative to 2012–2021 (“today”) for 156 countries under three emissions scenarios (columns) and three management scenarios (rows).
The percentage labels indicate the percentage of countries falling in each quadrant of catch and profit outcomes. Note that changes in catch and profits do not always match. This occurs when climate change and management strategies differentially favor more productive but less profitable species relative to less productive but more profitable species.

