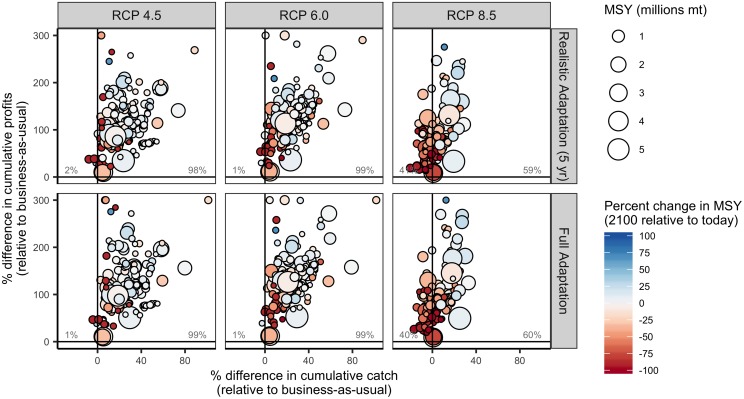
Fig 6. Percent difference in cumulative catch and cumulative profits from 2012–2100 relative to business-as-usual for 156 countries under three emissions scenarios (columns) and two adaptation scenarios (rows).
The percentage labels indicate the percentage of countries falling in each quadrant of catch and profit outcomes.

