
Fig 5. Dose-response relationships between HDL value index and SMD value outcomes based on data from each studies.
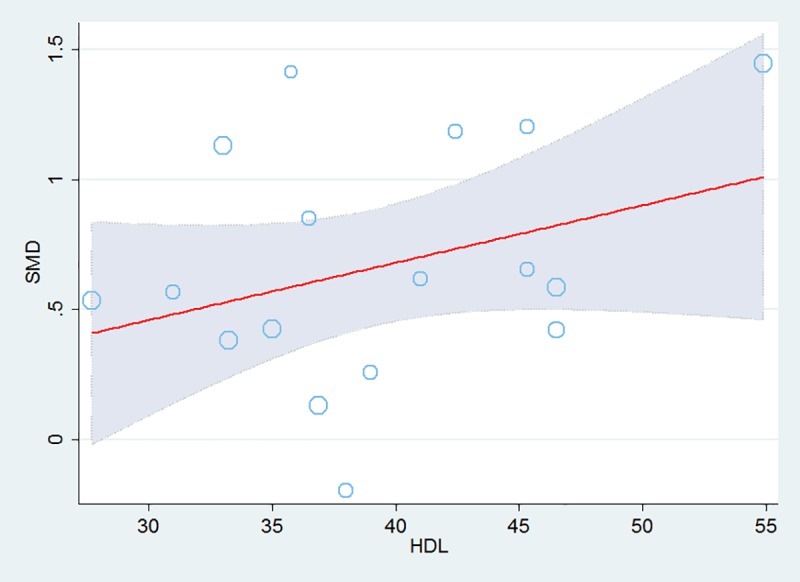
Each data point overlaps into a circle. The size of the circle corresponds to the inverse variance weight of the SMD effect in the analysis.MetS, Metabolic syndrome; SMD, standardized mean difference.