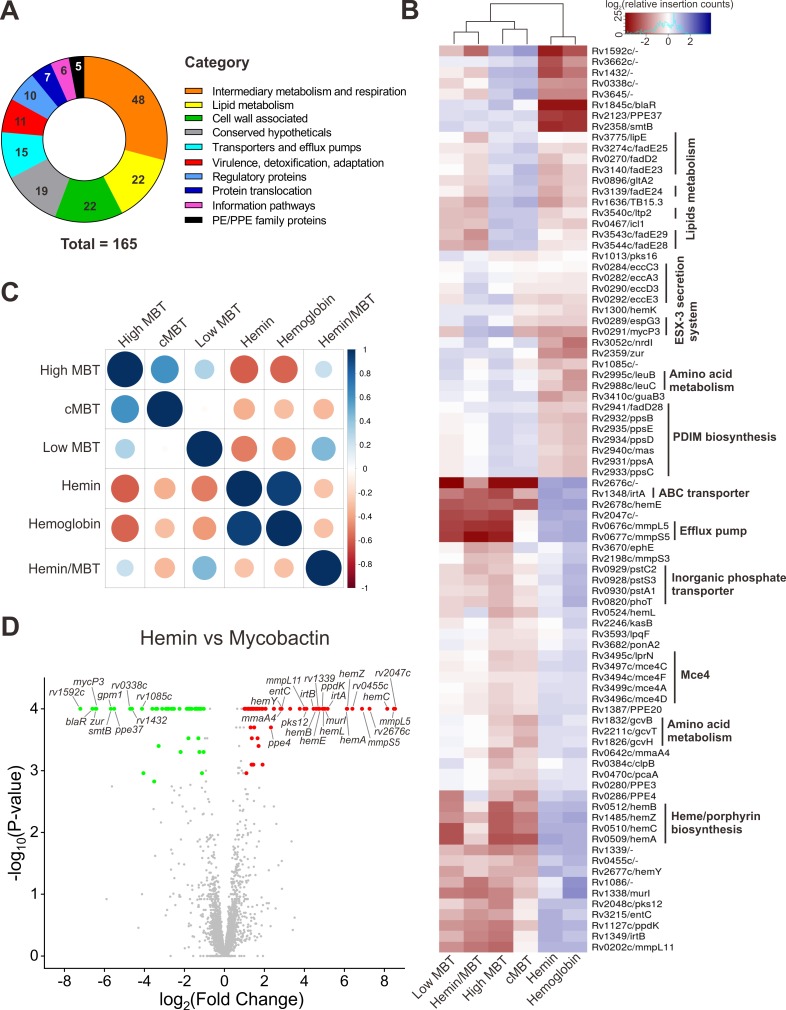
Fig 3. TnSeq analysis of the M. tuberculosis transposon libraries.
A subset of 165 varying genes were identified by ANOVA. The mean normalized insertion count is calculated for each gene in each of the 6 conditions. Then a log-fold-change is calculated for each condition relative to the mean count across all the conditions. (A) The 165 varying genes were categorized by different physiological functions as annotated in TubercuList [44]. (B) Heatmap with 84 selected genes (See full heatmap in S1 Fig) showing variability in transposon insertion counts across iron-supplementation conditions. The color 'red' means the counts in one condition are lower than the other conditions on average, suggesting a greater requirement for that gene in that condition, and 'blue' means insertion counts are higher than average, suggesting it is less required. The dendrogram shows the hierarchical clustering of the conditions (columns) using complete-linkage clustering. Gene insertion count profiles (rows) are also clustered using the hclust package in R, and gene pathway associations are indicated. (C) Correlation plot between each pair of iron-supplementation conditions. The correlation coefficients between pairs of conditions are calculated between vectors of log-fold-changes for the varying genes. The size of each circle indicates the magnitude of the correlation, and the color indicates the sign, as shown by the scale. (D) Volcano plot of resampling analysis between hemin and high MBT conditions. TnSeq-FC- and false discovery rate-adjusted P values (q values) from the resampling test are plotted for each genetic locus. Loci meeting the significance threshold of a q value of <0.05 are colored. The genes with increased log-fold-change or decreased minus log-fold-change are predicted to have more essentiality in utilizing mycobactin or hemin, respectively. Selected mutants are indicated by name.

