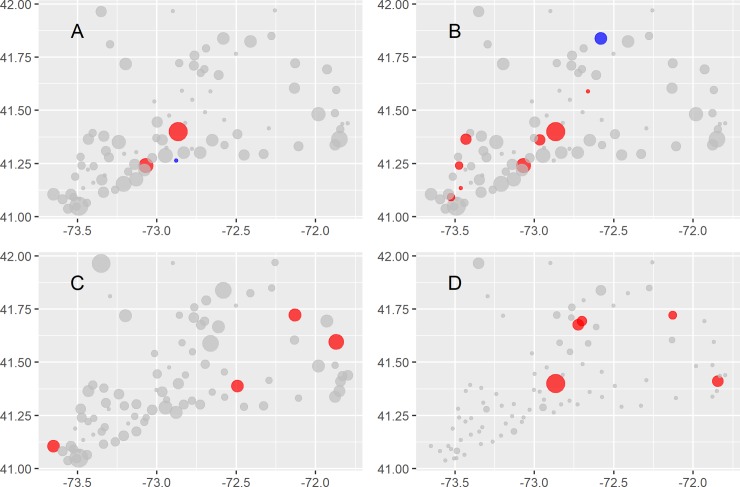
Fig 7.
Risk maps for the mammalian arboviruses: Cache Valley virus (A), Jamestown Canyon virus (B), Potosi virus (C), Trivittatus virus (D). Point sizes correspond to the number of isolates scaled to the maximum number of isolates detected while colors indicate whether the 95% confidence interval for the odds of arbovirus detection were > 1 (red), included 1 (grey), or were < 1 (blue).

