. 2020 Feb 24;9:e52668. doi: 10.7554/eLife.52668

Figure 5. Addition of TNF-α increases Mtb growth in microspheres in normoxia.

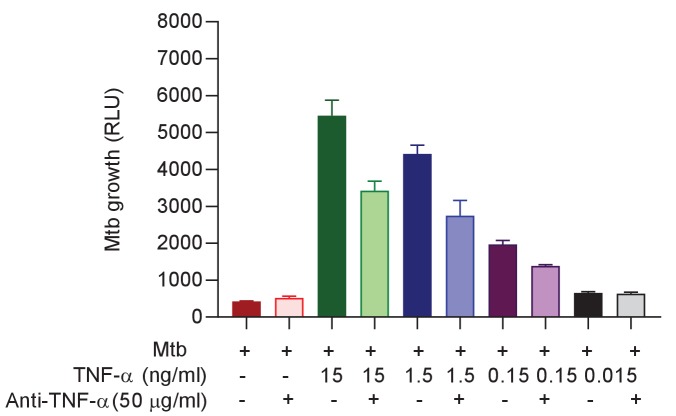
Recombinant human G-CSF, GM-CSF, IL-4, IL-6, IL-10, IL-12, TNF-α, IL-1RA, MIP-1α, MIP-1β or RANTES were added either individually (A and B) or in combination pools (C) to Mtb-infected microspheres at ‘low’ concentrations, defined as that measured in media around spheres after anti-PD-1 treatment. Recombinant human TNF-α increases growth of Mtb, whilst other pro-inflammatory cytokines did not (A). GM-CSF has a lesser growth-promoting effect (B). The only combination pool that increased Mtb growth was the pro-inflammatory cytokine pool, containing TNF-α (C). (D) TNF-α results in a dose-dependent increase in the Mtb growth over time. (E) Anti-TNF-α neutralising antibodies partially suppress the increased Mtb growth caused by TNF-α augmentation. Anti-TNF-α from Thermo Fisher Scientific. (F) Anti-PD1 antibody incorporation within microspheres increases of Mtb growth at day 7, and this effect is reversed by concurrent anti-TNF-α neutralising antibodies within microspheres. The constituent of the cytokine pools are: Growth factor pool (GF: GM-CSF and G-CSF), Anti-Inflammatory cytokine pool (Anti-Inf: IL-10 and IL-1RA), Pro-Inflammatory cytokine pool (Pro-Inf: TNF-α, IL-6 and IL-12) and Chemokine pool (Chemo: RANTES, MIP-1α, MIP-1β).

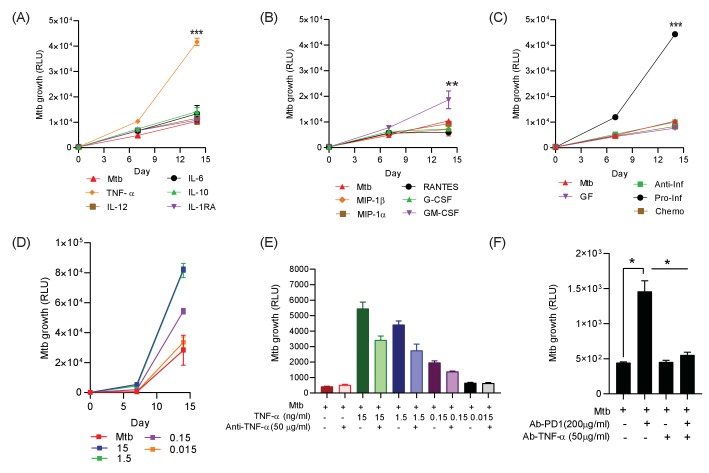
Figure 5.

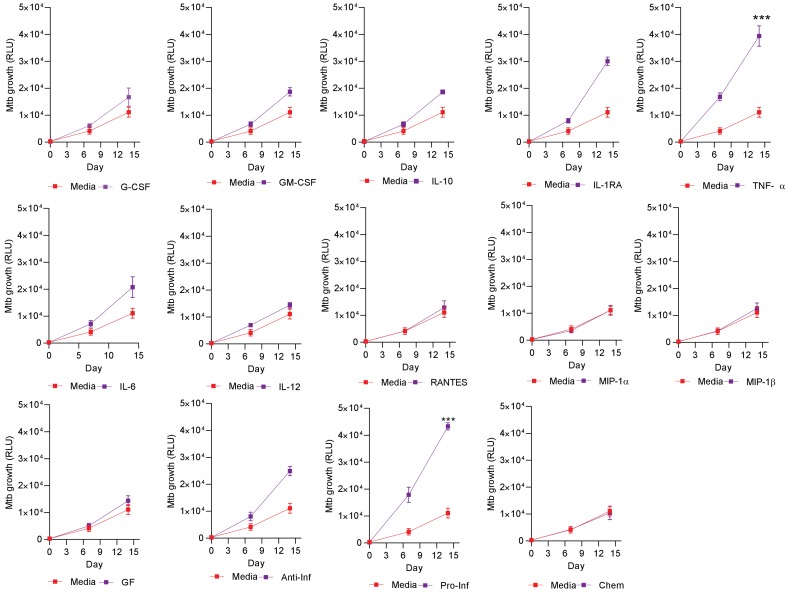
Figure 5—figure supplement 1. Individual Mtb growth curves at ‘high’ cytokine concentration, five times the concentration measured in media after anti-PD-1 treatment.

Figure 5—figure supplement 1.

Human recombinant G-CSF, GM-CSF, IL-4, IL-6, IL-10, IL-12, TNF-α, IL-1RA, MIP-1α, MIP-1β and RANTES were added to microspheres either individually or in combination pools to microspheres at five times the concentrations in Figure 5, determined by the concentration measured in the media around the microspheres. TNF-α increases Mtb growth in microspheres alone and in the pro-inflammatory pool.
Figure 5—figure supplement 2. Anti-TNF-α neutralizing antibodies supress the Mtb growth following TNF-α from a different source (Anti-TNF-α from Sigma-Aldrich, UK).

Figure 5—figure supplement 2.

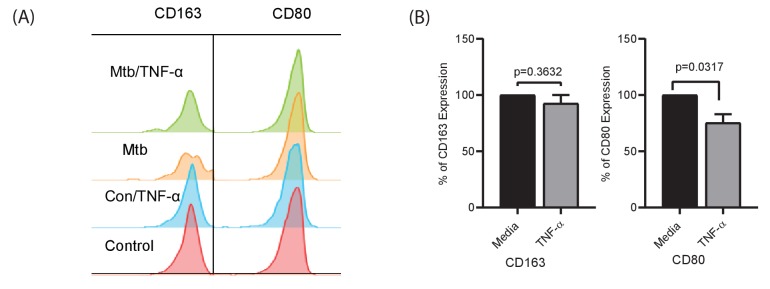
Figure 5—figure supplement 3. TNF-α skews polarization of monocytes to macrophages with lower CD80 expression.

Figure 5—figure supplement 3.

PBMCs were infected with Mtb H37Rv at MOI of 0.1 and encapsulated in alginate-collagen microspheres after overnight incubation. Microspheres were then incubated in complete RPMI (with L-Glutamine and 10% human serum) with TNF-α 7.5 ng/ml. Uninfected PBMCs were encapsulated and treated similarly as a comparator for TNF-α stimulation. At day 7, the microspheres were decapsulated in 0.5 mM EDTA solution at pH of 7.2. Double staining with CD14 and CD11b defined macrophages, which were classified by CD80 and CD163 expression. (A) Histogram showing expression of CD163 and CD80 where there was significant decrease in CD80 expression as shown if Figure (B). TNF suppressed the relative geometric mean of CD80, but did not affect CD163 expression. This experiment was performed in four separate donors.
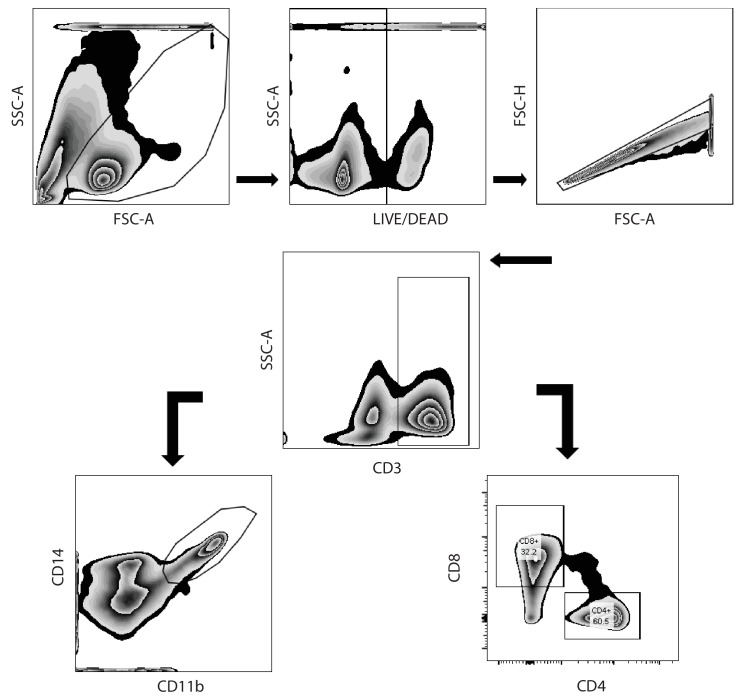
Figure 5—figure supplement 4. Hierarchical gating strategy used to identify lymphocyte and monocytic populations from decapsulated microspheres containing human peripheral blood monocular cells.

Figure 5—figure supplement 4.

Single cells were decapsulated from microspheres in 5 mM EDTA, washed and processed for flow cytometry. First doublets were excluded from live cells, then cells were gated as CD3+ and CD3-. Subsequently, lymphocytes were further classified into CD4+ and CD8+, which are sub-categorized based on PD-1 staining. Double staining with both CD14 and CD11b defined macrophages, which were further analysed for PD-L1, CD80 and CD163 surface expression. All the antibodies and clone number are listed in the text and the key resources table.