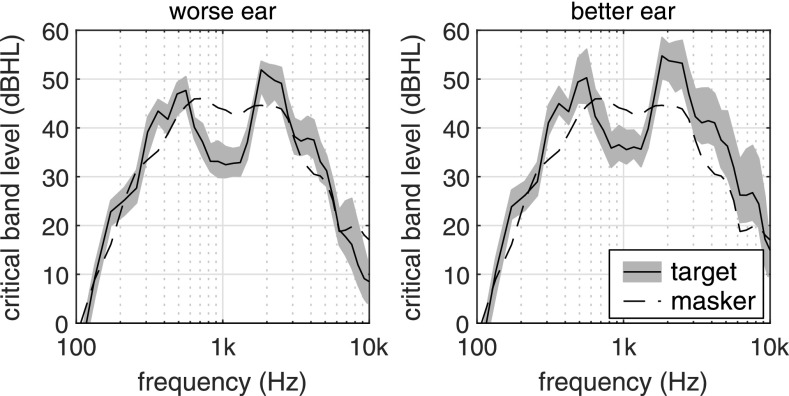
FIG. 3.
Critical band levels measured with a HATS at the location of the listener and plotted relative to normal-hearing pure-tone thresholds. The combined distractor level averaged across ears is shown by the dashed lines. The mean level (solid lines) and level range (grey shaded areas) of the 41 target stimuli are shown separately for the ear with the better (left panel) and worse (right panel) level, which, dependent on the target direction, can either refer to the left or right ear.

