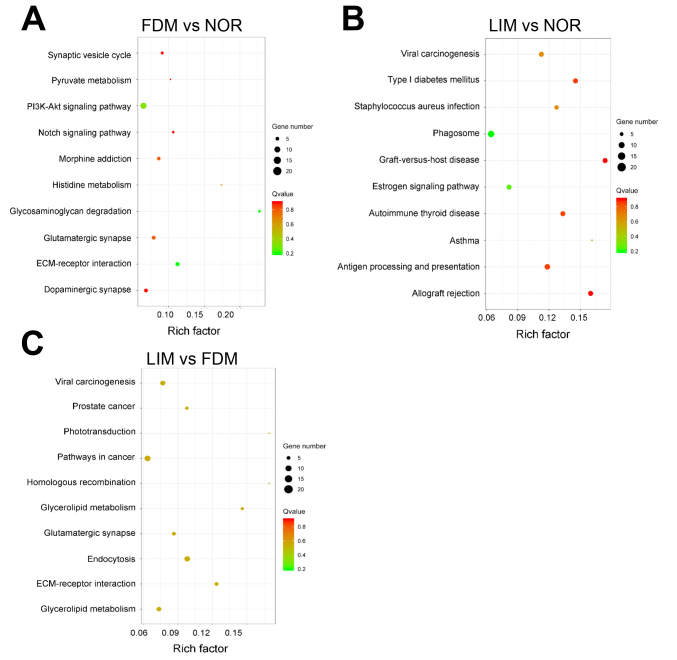
Figure 8.
KEGG analysis reveals the top ten signaling pathways most enriched with the target genes of the differentially expressed lncRNAs. Rich factor: the proportion of candidate genes in the background gene. The size of the bubble is proportional to the number of target genes enriched in the pathway, and the color of the bubble corresponds to the Q value. NOR: normal control; FDM: form-deprivation myopia; LIM: lens-induced myopia.

