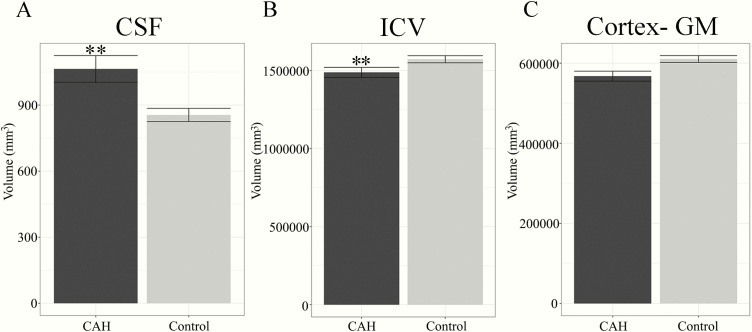
Figure 1.
Global brain volumes in youth with classical CAH and in healthy controls. Plots reflect means and standard error of volumes for: A) cerebrospinal fluid (CSF), B) intracranial volume (ICV), and C) cortex, gray matter (GM). A) CSF is significantly larger in CAH compared to control youth (** P ≤ 0.01). B) ICV is significantly smaller in CAH compared to control youth (** P ≤ 0.01).

