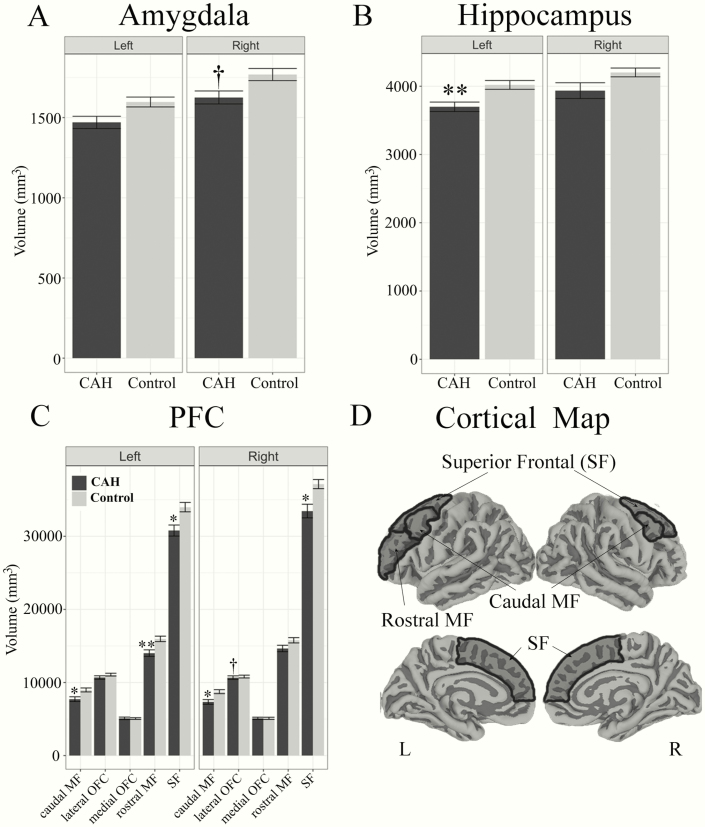
Figure 2.
Total amygdala, hippocampus, and prefrontal cortex (PFC) volumes in youth with classical CAH and controls by hemisphere. Plots reflect means and standard error of volumes for: A) amygdala, B) hippocampus, and C) prefrontal cortex (PFC) regions of interest. A) Trend level difference was seen for smaller total right amygdala volumes in CAH compared to control youth (†P = 0.10). B) Left hippocampus is significantly smaller in CAH compared to control youth (** P ≤ 0.01). C) Bilateral superior frontal (SF) cortex volumes (* P ≤ 0.05) and caudal middle frontal (MF) cortex volumes (* P ≤ 0.05) were significantly smaller in CAH compared to control youth. Left rostral middle frontal volumes were significantly smaller in CAH compared to control youth (** P ≤ 0.01). Trend level difference was seen for smaller right lateral orbitofrontal cortex (OFC) volumes in CAH compared to control youth (†P = 0.07). D) Significant PFC regions of interest mapped to the cortex for visualization (dark gray).

