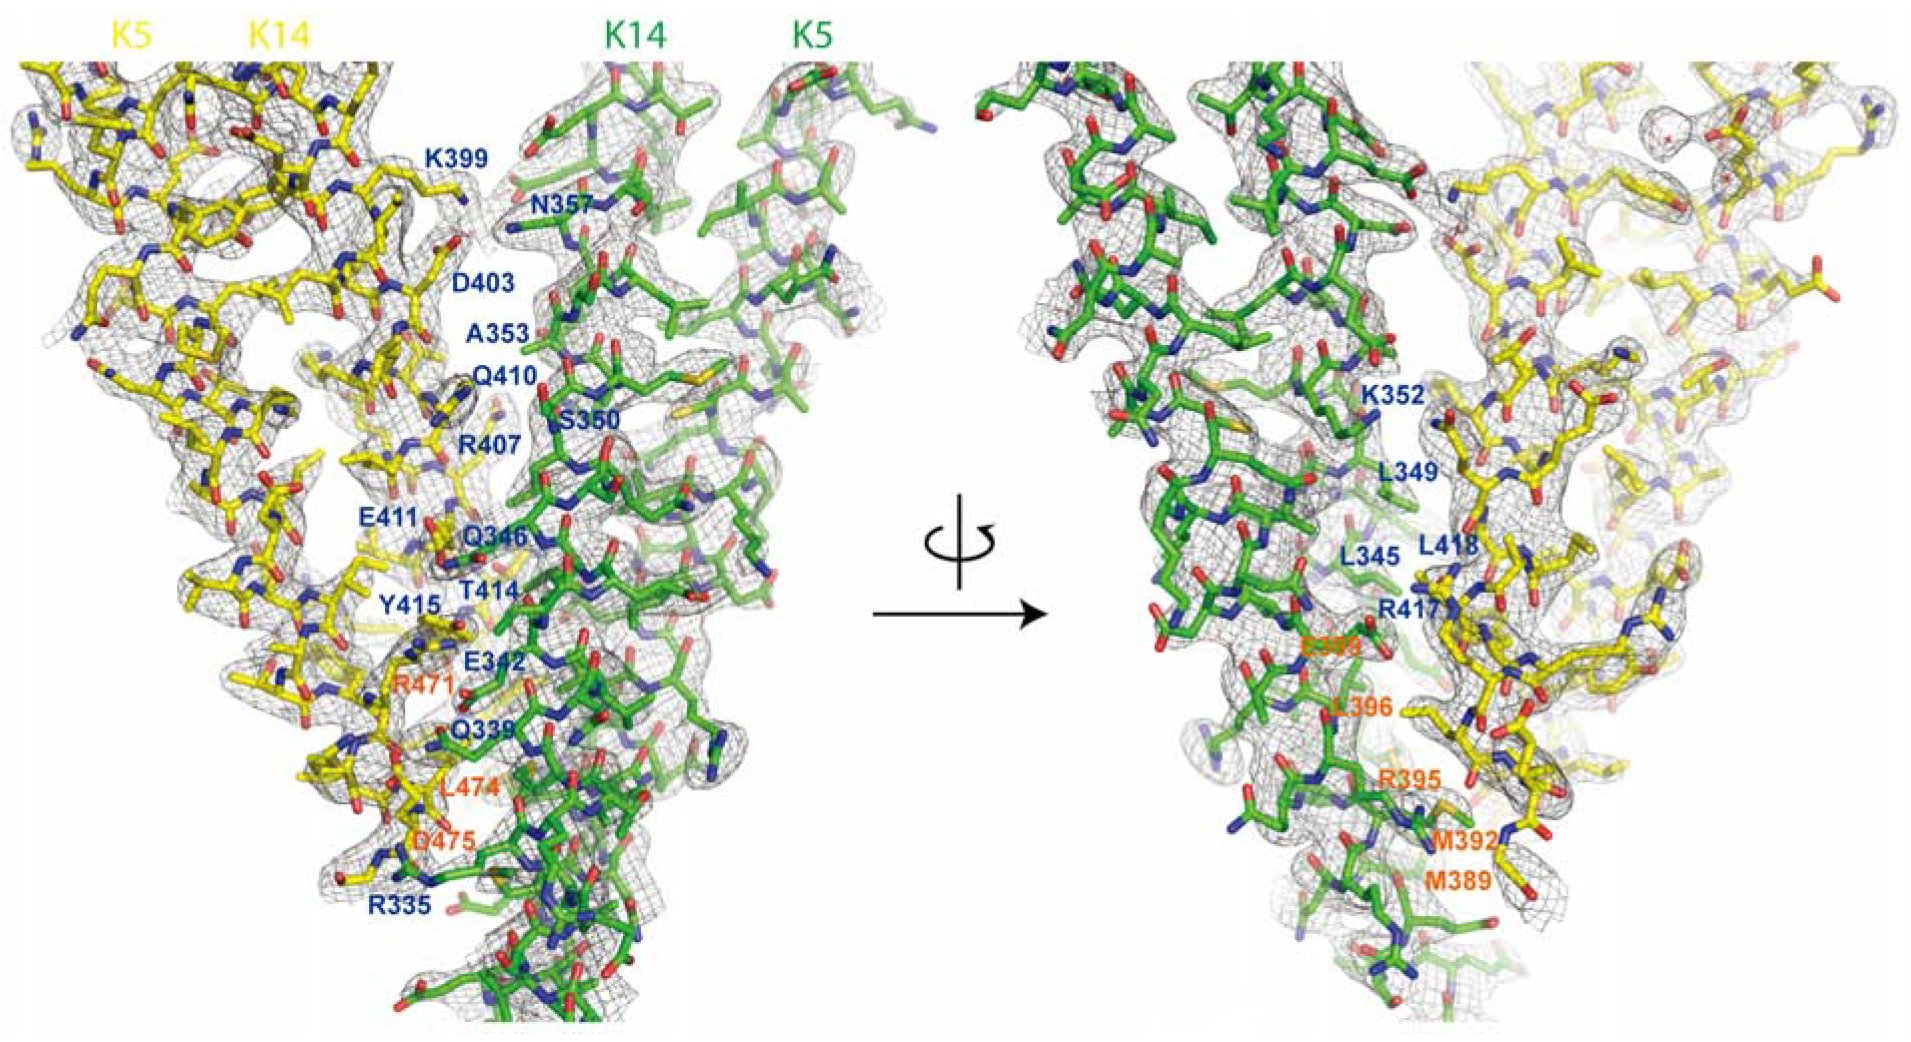
Figure 2. Electron density map of ID1 contact.

One heterodimeric complex of K14-K5 is shown in green and interacting partner shown in yellow. The residues involved in dimer-dimer interactions are labeled. K14 resides are shown in blue and K5 residues are shown in orange. The 2Fo-Fc electron density map (shown in gray mesh) are contoured at 1.0σ. The left and right models are identical but rotated 180° along the y-axis.
