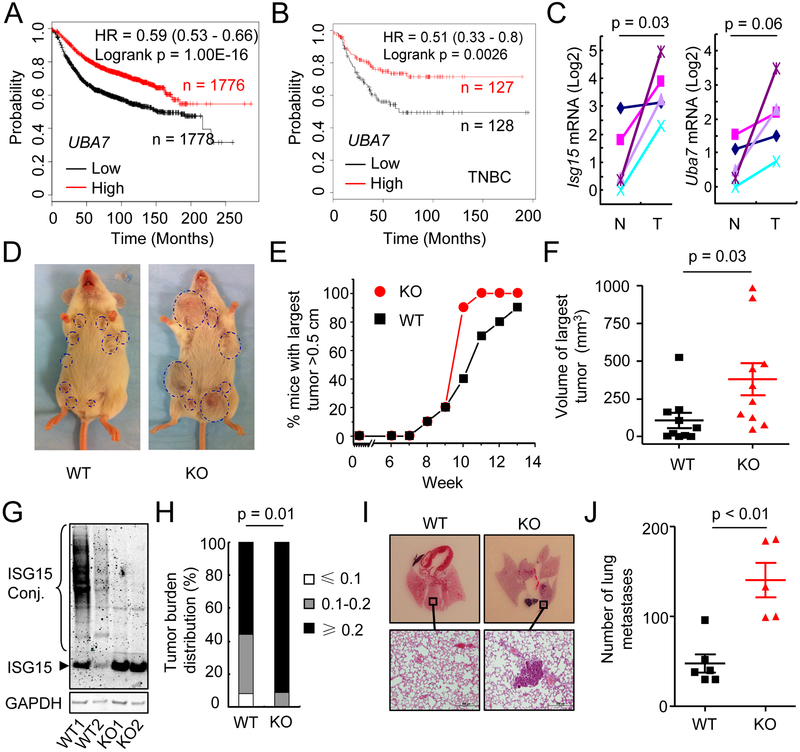
Figure 1. Evidence for the ISGylation-activating enzyme UBA7 as a tumor suppressor.
A, Kaplan-Meier curves showing the correlation between Relapse Free Survive (RFS) and UBA7 expression in breast cancer (Affymetrix ID 203281_at UBA7).
B, Kaplan-Meier curves showing the correlation between RFS and UBA7 expression in triple negative breast cancer (TNBC) (Affymetrix ID 203281_at UBA7).
C, Expression of Isg15 and Uba7 in tumors compared with their adjacent normal tissues from PyVmT WT mice at 10 weeks of age (n = 5). p, paired t-test.
D, Representative photograph of PyVmT/WT and PyVmT/Uba7 KO mice at 10 weeks of age.
E, Percentage of mice with largest tumor diameter above 0.5 cm (n = 10/group).
F, Tumor volume of largest tumors in PyVmT/WT and PyVmT/Uba7 KO mice at 10 weeks of age (n = 10/group). p, student’s t-test.
G, Representative level of ISG15 and protein ISGylation in tumor tissue from PyVmT/WT and PyVmT/Uba7 KO mice.
H, Tumor burden (total tumor weight/body weight) distribution of PyVmT/WT (n = 25) and PyVmT/Uba7 KO (n = 23) mice at the endpoint. p, Fisher’s exact test.
I&J, Number of spontaneous lung metastasis in PyVmT/WT and PyVmT/Uba7 KO mice. Serial lung sections were stained with H&E (n = 5–6). p, student’s t-test.

