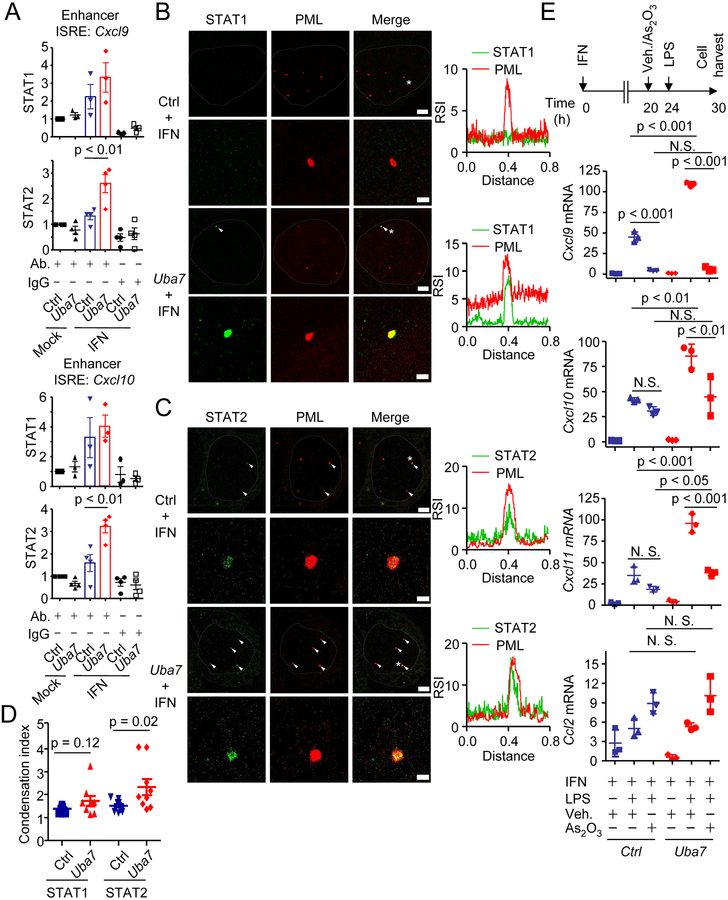
Figure 4. ISGylation and PML cooperatively modulate the function of nuclear STATs and chemokine expression.
A, Quantitative ChIP-qPCR analysis of STAT1/STAT2 binding at enhancer ISREs of Cxcl9/10 in Ctrl or Uba7 MECs treated with or without IFN for 24h (mean + SEM, n = 3–4). p, One-way ANOVA Post-hoc Tukey’s test.
B & C, Colocalization analysis of PML bodies (red) and STAT1(B, green) and STAT2 (C, green) by expansion microscopy. PML bodies contain STAT1 or STAT2 were indicated by white arrows (Scale bar = 2 μm). Representative PML bodies (with asterisk) with higher magnification images and their plot profiling for the relative signal intensity of each protein are shown (Scale bar = 500 nm). Nucleus was outlined by dotted lines. RSI, relative signal intensity.
D, Comparison of STAT1/STAT2 signals around the PML bodies. The condensation index was defined as ratio of the mean intensity around PML bodies to the rest of nuclei (mean ± SD, n = 9–11). p, student’s t-test.
E, RT-qPCR analysis of chemokine expression upon arsenic treatment. Ctrl or Uba7 MECs were treated with IFN for 24h, and As2O3 or vehicle was added 4h prior to the LPS stimulation (mean ± SD, n = 3). p, One-way ANOVA Post-hoc Tukey’s test.

