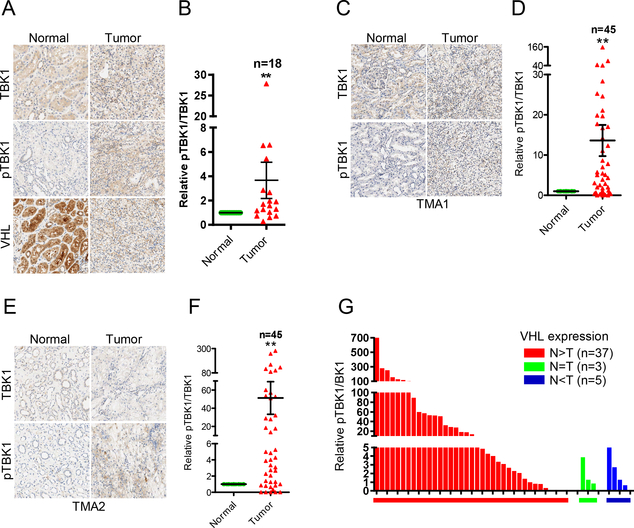
Figure 5. Phosphorylation of TBK1 increases in ccRCC tumor tissues.
A-F, Representative TBK1 and pTBK1 (Ser172) IHC staining pictures and quantification of relative pTBK1/TBK1 signal intensity of tumor and paired normal tissues from a 21-pair ccRCC cohort (A, B), ccRCC TMA1 (C, D) and TMA2 (E, F). Error bars represent SEM, **P<0.01, ***P<0.001 (Wilcoxon matched pairs test).
G, Samples from TMA2 are divided into 3 groups based on VHL expression. Bars represent relative pTBK1/TBK1 ratio of each tumor sample.

