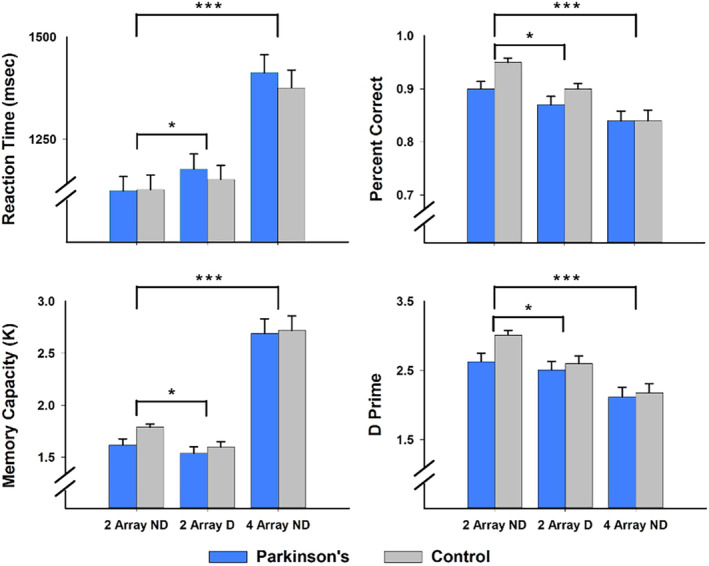
Figure 2.

Working memory performance in the PD and control groups. Mean and standard error bars are graphed for reaction time, percent correct, memory capacity (K), and d prime. Group differences in the effects of distraction and memory load were not significant for any of the working memory measures. Brackets signify the significance of distraction and memory load effects on working memory performance in both groups (***p < .0001; *p < .01)
