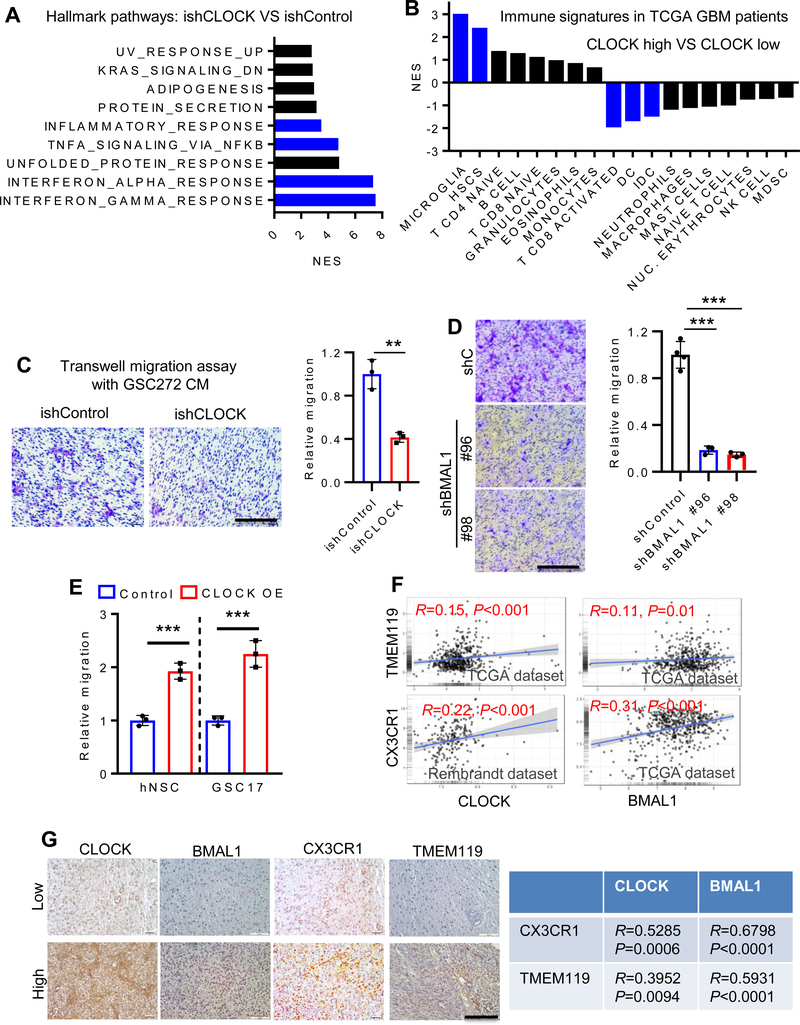
Figure 2. CLOCK promotes microglia infiltration in GBM.
(A) Transcriptomic profiling in GSC272 cells following CLOCK depletion shows top ten enriched hallmark pathways by GSEA. Blue bars indicate the signatures relate to immune response.
(B) GSEA analysis shows the normalized enrichment score of various types of immune cells in CLOCK-high and CLOCK-low patients in TCGA GBM Provisional dataset (n = 528). Microglia are the most enriched immune cells in CLOCK-high patients. The lower quartile was set to the cut-off value. Blue bars indicate FDR<0.25. (C) Conditioned media from CLOCK-depleted GSC272 cells shows reduced ability to attract human HMC3 microglia in a transwell assay. Representative images (left panel) and quantification (right panel). Scale bar, 200 μm; n = 3 biological replicates; **P <0.01.
(D) Conditioned media from BMAL1-depleted GSC20 cells shows reduced ability to attract HMC3 microglia in a transwell assay. Representative images (left panel) and quantification (right panel). Scale bar, 200 μm; n = 3–4 biological replicates; ***P <0.001.
(E) Conditioned media from CLOCK-overexpressed hNSCs and GSC17 promotes HMC3 microglia migration in a transwell assay. n = 3 biological replicates; ***P <0.001.
(F) CLOCK and BMAL1 expression is positively correlated with microglia markers (TMEM119 and CX3CR1) in TCGA and Rembrandt GBM databases.
(G) CLOCK and BMAL1 expression is positively correlated with CX3CR1 and TMEM119 expression in human GBM TMA samples. Left panel, representative images showing low and high expression levels of CLOCK, BMAL1, CX3CR1 and TMEM119 in human GBM TMA (n = 35). Scale bar, 100 μm; Right panel, quantification data showing strong positive correlations between CLOCK/BMAL1 and CX3CR1/TMEM119in human GBM TMA. R and P values are shown.

