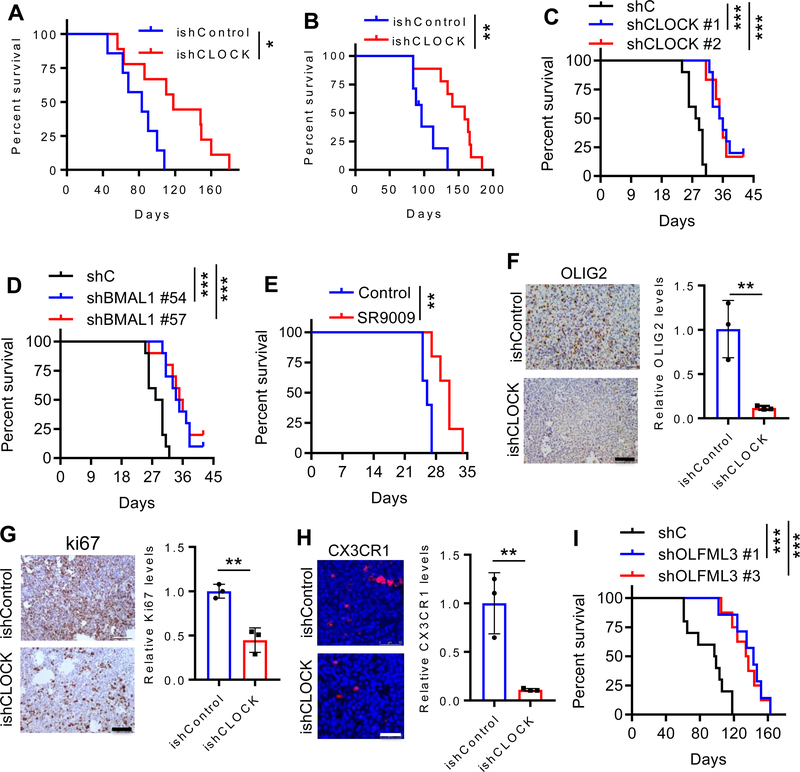
Figure 4. CLOCK depletion extends survival, and inhibits GSC self-renewal and microglia infiltration.
(A) Survival curves of SCID mice implanted with ishCLOCK and ishControl GSC272 cells (5×10⁵ cells). Dox food was provided at day 30 post-orthotopic injection to induce CLOCK knockdown in vivo. (n = 7 and 9 mice for ishControl and ishCLOCK groups, respectively). *P <0.05.
(B) Survival curves of SCID mice implanted with ishCLOCK and ishControl GSC20 cells (5×10⁵ cells). Dox food was provided at day 30 post-orthotopic injection to induce CLOCK knockdown in vivo. (n = 7 and 9 mice for ishControl and ishCLOCK groups, respectively). **P <0.01.
(C) Survival curves of C57BL/6 mice implanted with CT2A cells (2×10⁴ cells) expressing shRNA control (shC) or CLOCK shRNAs. (n = 10, 10 and 6 mice for shC, shCLOCK #1 and shCLOCK #2 groups, respectively). ***P <0.001.
(D) Survival curves of C57BL/6 mice implanted with CT2A cells (2×10⁴ cells) expressing shRNA control (shC) or BMAL1 shRNAs. (n = 10 mice per group). ***P <0.001.
(E) Survival curves of C57BL/6 mice implanted with CT2A cells (2×10⁴ cells). Mice were treated with SR9009 (100 mg/kg, i.p., daily) for 10 days beginning at day 7 post-orthotopic injection. (n = 5 mice per group). **P <0.01.
(F) IHC (left panel) and quantification (right panel) of OLIG2 in mouse tumors from ishCLOCK and ishControl GSC272 models. Scale bar, 100 μm; n = 3 biological replicates; **P <0.01.
(G) IHC (left panel) and quantification (right panel) of Ki67 in mouse tumors from ishCLOCK and ishControl GSC272 models. Scale bar, 100 μm; n = 3 biological replicates; **P <0.01.
(H) Immunofluorescence (left panel) and quantification (right panel) of microglia marker CX3CR1 in mouse tumors from ishCLOCK and ishControl GSC272 models. Scale bar, 100 μm; n = 3 biological replicates; **P <0.01.
(I) Kaplan-Meier survival curves of SCID mice implanted with GSC272 cells (5×10⁵ cells) expressing shRNA control (shC) or OLFML3 shRNAs (n=10, 7 and 8 mice for shC, shOLFML3 #1 and shOLFML3 #3 groups, respectively). ***P <0.001.

