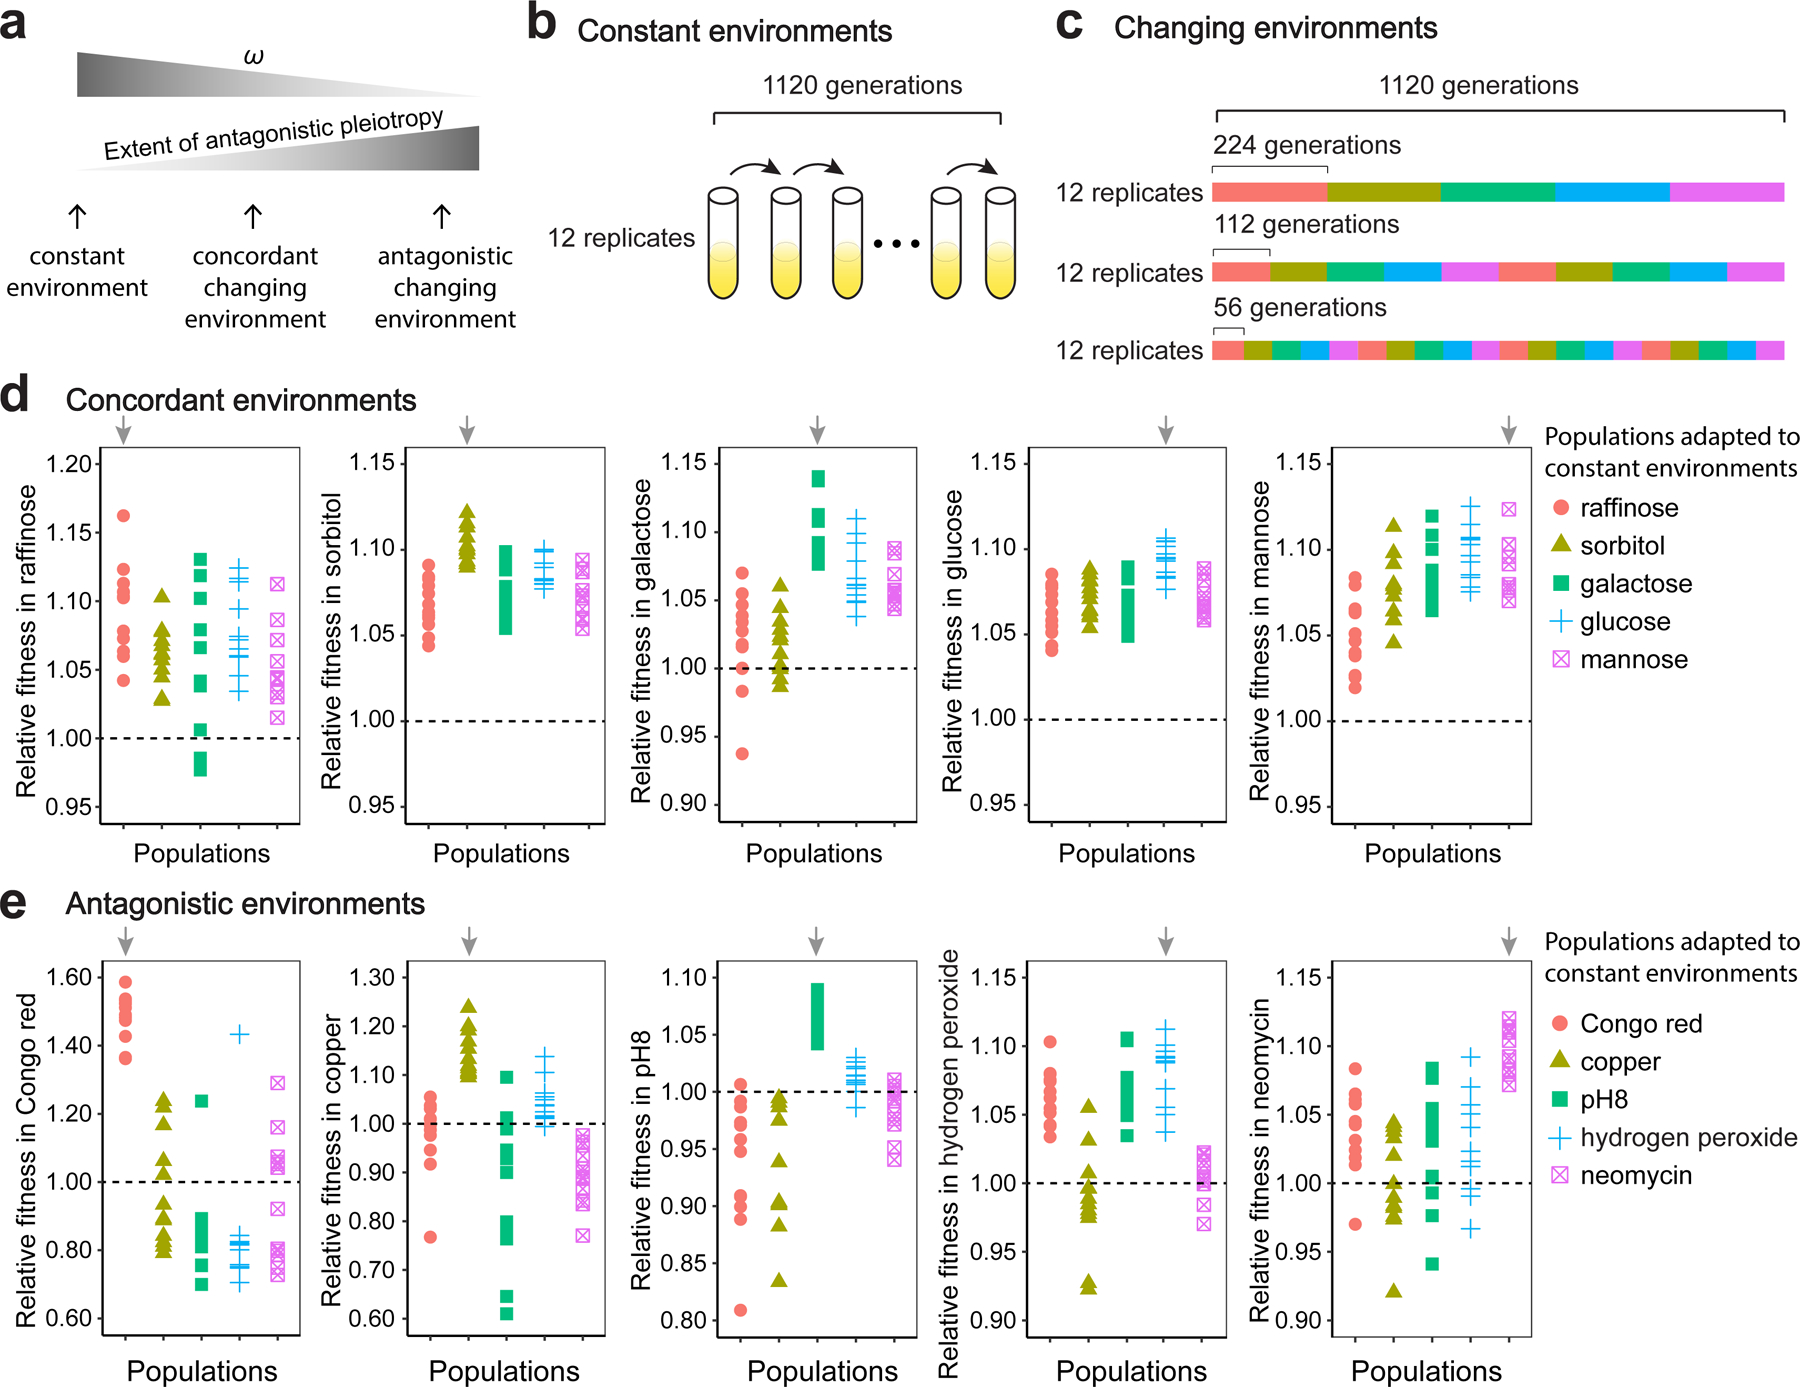
Figure 1. Experimental evolution of yeast in constant and changing environments.

(a) Schematics showing predictions on the extent of antagonistic pleiotropy and ω in different environments. (b) Schematics showing experimental evolution in a constant environment for 1,120 generations. This experiment is performed with 12 replicates for each of the 10 environments shown in (d) and (e). (c) Schematics showing experimental evolution in a changing environment that rotates among five antagonistic or five concordant conditions with three different frequencies (each condition lasted for 224, 112, or 56 generations). Each scheme has 12 replicates. Colors indicate various environments described in (d) or (e). (d) Fitness of each adapted population relative to the progenitor in the constant environment where the adaptation occurred or in the other four concordant, constant environments. (e) Fitness of each adapted population relative to the progenitor in the constant environment where the adaptation occurred or in the other four antagonistic, constant environments. In (d) and (e), each symbol represents mean fitness of an adapted population (based on three measurements) relative to the mean fitness of the progenitor (based on 12 measurements). A total of 1920 measurements (120 populations × 5 assayed environments × 3 replicates + 1 progenitor population × 10 assayed environments ×12 replicates) were performed here. Arrows indicate populations for which the adaptation and fitness measurement occurred in the same environment.
