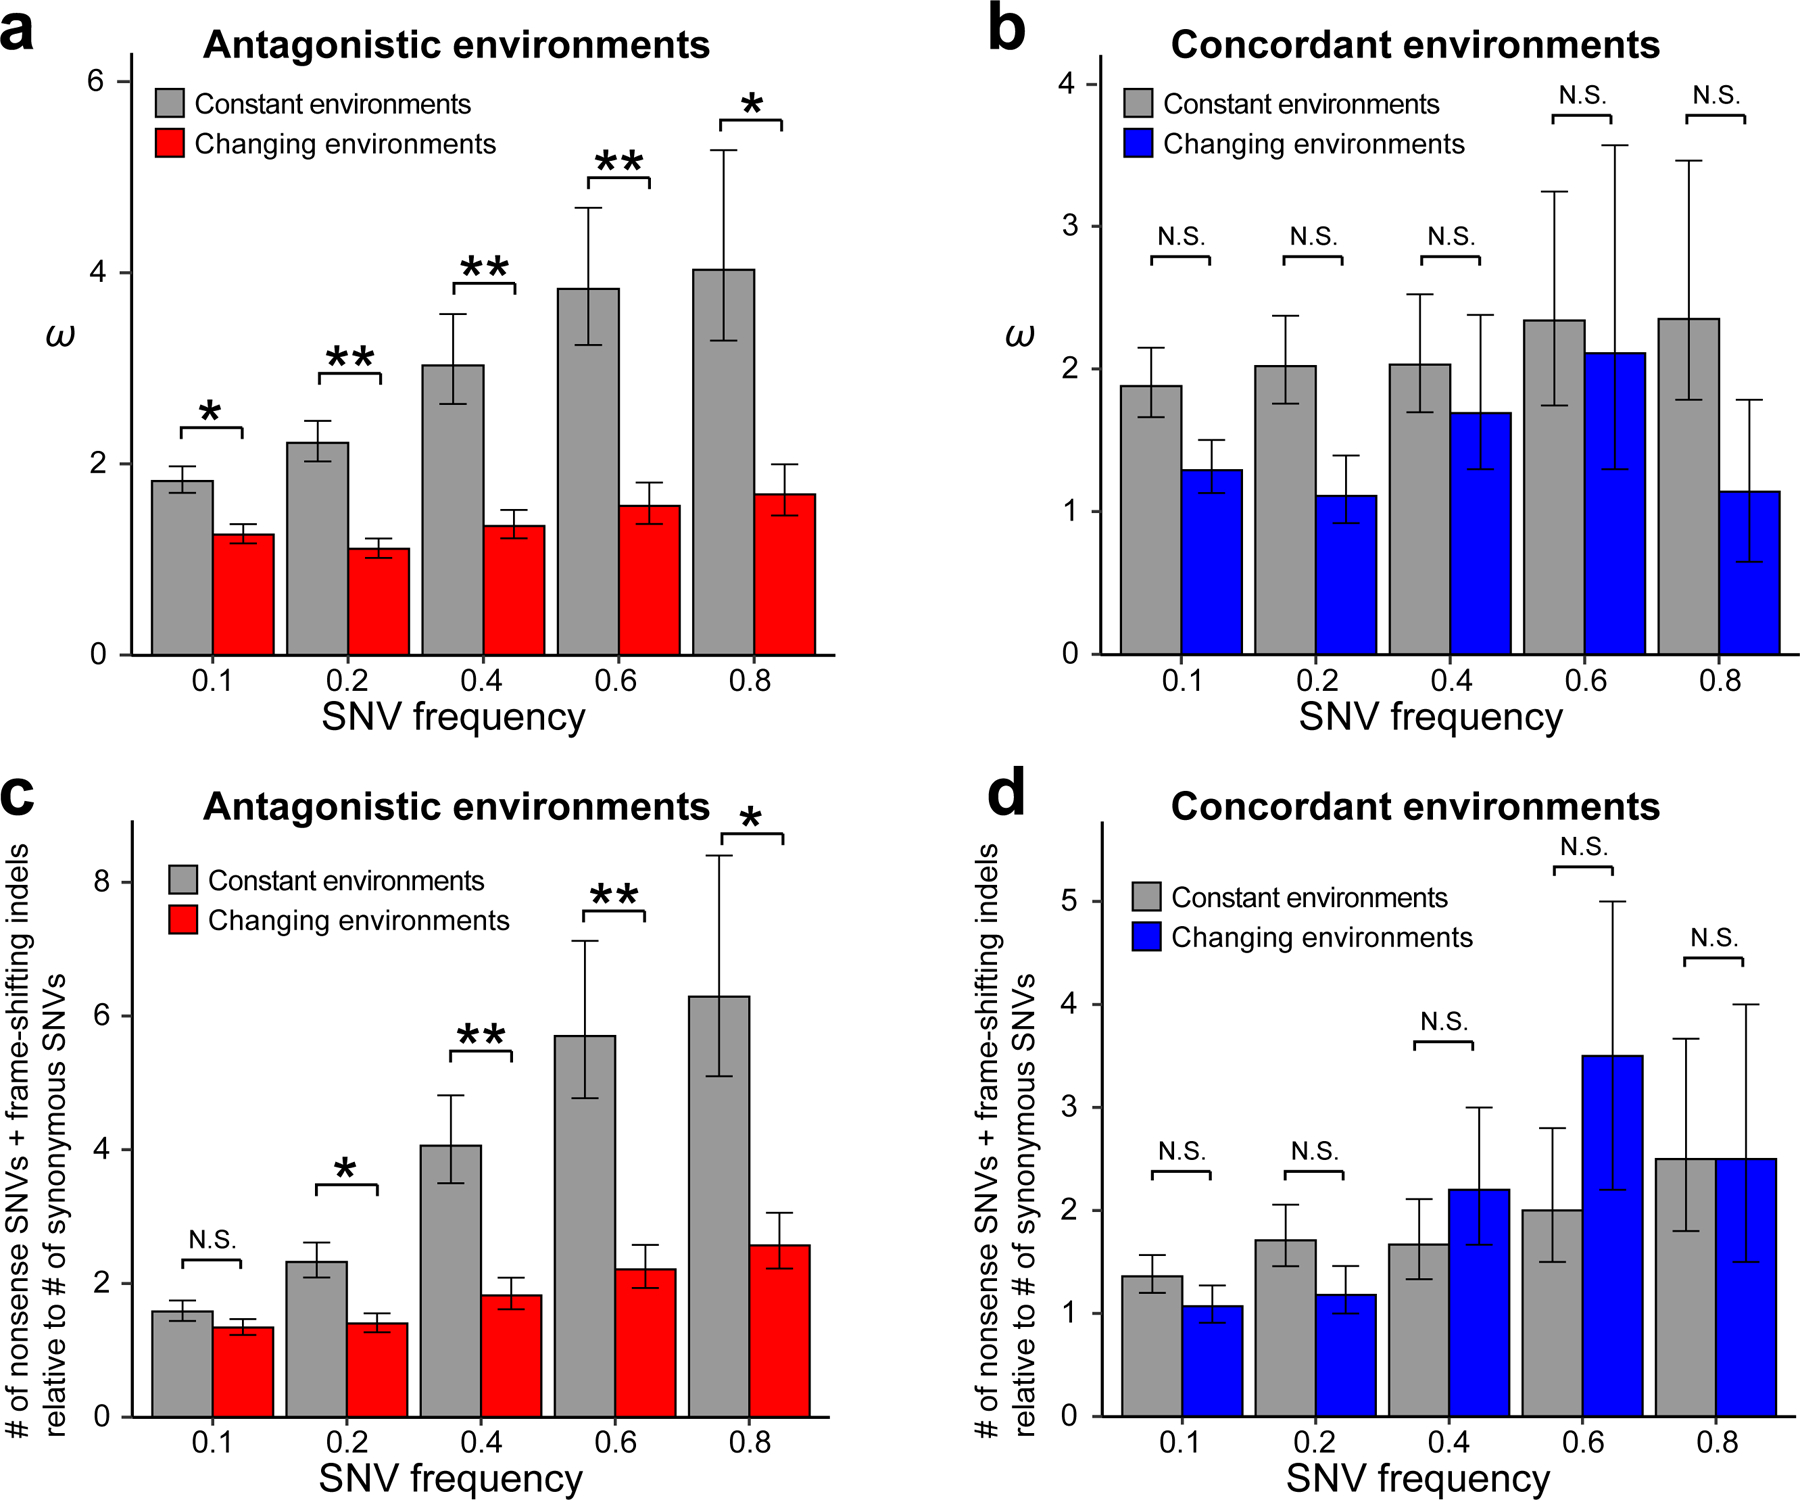
Figure 2. The rate of molecular evolution in constant and changing environments.

(a) The rate ratio (ω) of nonsynonymous to synonymous nucleotide changes is significantly lower in the antagonistic changing environments than in the corresponding constant environments, regardless of the minimum frequencies of single nucleotide variants (SNVs) considered in the evolved populations. (b) ω is not significantly different between the concordant changing environments and the corresponding constant environments. (c) The ratio of the total number of nonsense SNVs and frame-shifting insertions/deletions (indels) to the number of synonymous SNVs is significantly lower in the antagonistic changing environments than in the corresponding constant environments. (d) The above ratio is not significantly different between the concordant changing environments and the corresponding constant environments. P-values are determined by bootstrapping the relevant populations 10,000 times and are indicated by * (P < 0.05), ** (P < 0.01), or N.S. (P > 0.05). Error bars indicate the first and third quartiles from bootstrapped data.
