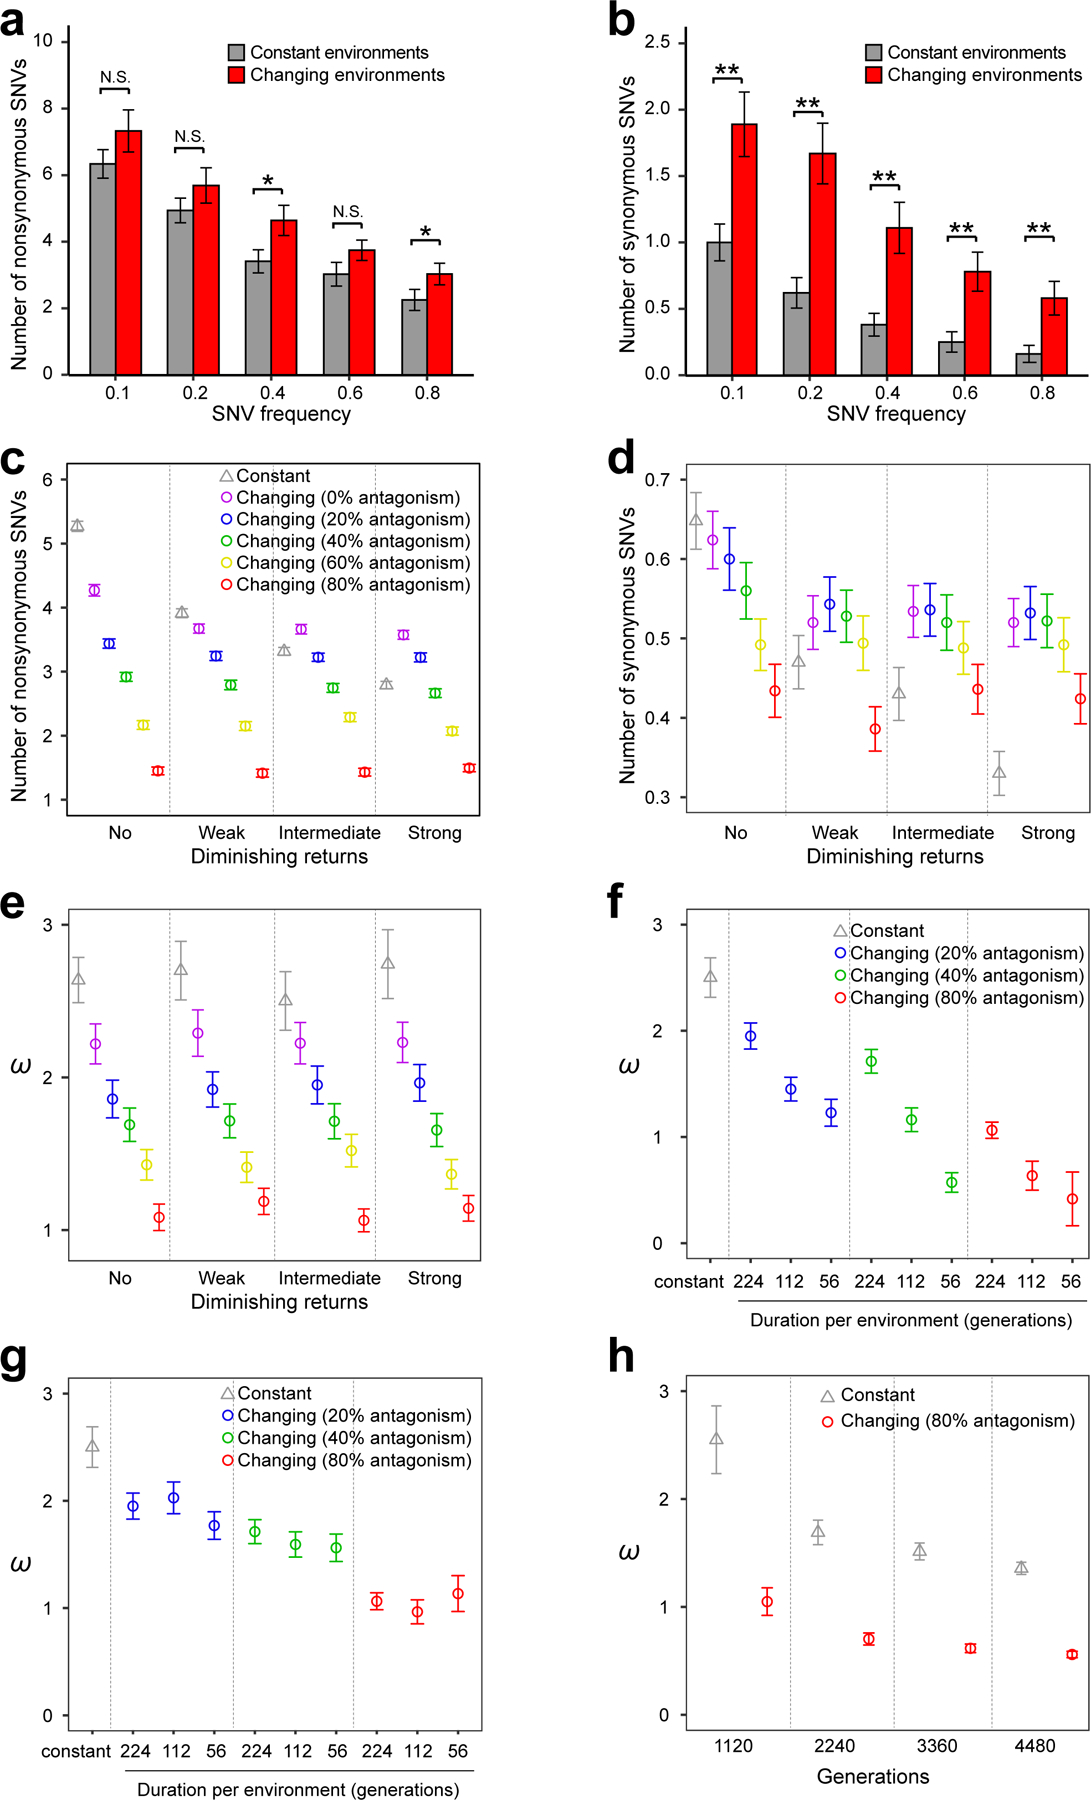
Figure 4. Computer simulation explains observations from the experimental evolution in the antagonistic changing or constant environments.

(a-b) Numbers of nonsynonymous (a) and synonymous (b) SNVs per population observed in experimental evolution are greater in the antagonistic changing environments than in the corresponding constant environments. Diploid lines are excluded. P-values are determined by bootstrapping the relevant populations 10,000 times and are indicated by * (P < 0.05), ** (P < 0.01), or N.S. (P > 0.05). Error bars indicate standard errors estimated by bootstrapping the populations. (c-e) Simulation shows that diminishing returns epistasis can reverse the relationship between constant and changing (antagonistic) environments in the numbers of nonsynonymous (c) and synonymous (d) SNVs but not in ω (e). X-axis shows the level of diminishing returns epistasis, whereas different colors represent different degrees of antagonism among environments (see Methods). Here the simulation lasted for 1,120 generations, with an environmental change every 224 generations. (f) Simulation reveals that ω decreases in antagonistic changing environments as the duration of each environment gets shorter. Simulation was performed by changing the environment to a new antagonistic condition every 224, 112, or 56 generations for a total of 1,120 generations, under the intermediate level of diminishing returns epistasis. (g) Simulation reveals no significant difference in ω among three different frequencies of environmental changes when the environment rotates among five fixed antagonistic conditions, under the intermediate level of diminishing returns epistasis. (h) Simulation shows that the estimated ω falls below 1 after a sufficient time of evolution under changing environments. The environment is changed to a new antagonistic condition every 224 generations, and the intermediate level of diminishing returns epistasis is considered. It takes longer for the estimated ω to fall below 1 under a lower degree of antagonism (e.g., 20% or 40%). In (c)-(h), under each parameter set, the mean from 1000 simulated populations is presented. Error bars indicate standard errors, estimated by bootstrapping the simulated populations 1000 times. All SNVs with a minimal allele frequency of 0.8 are considered.
