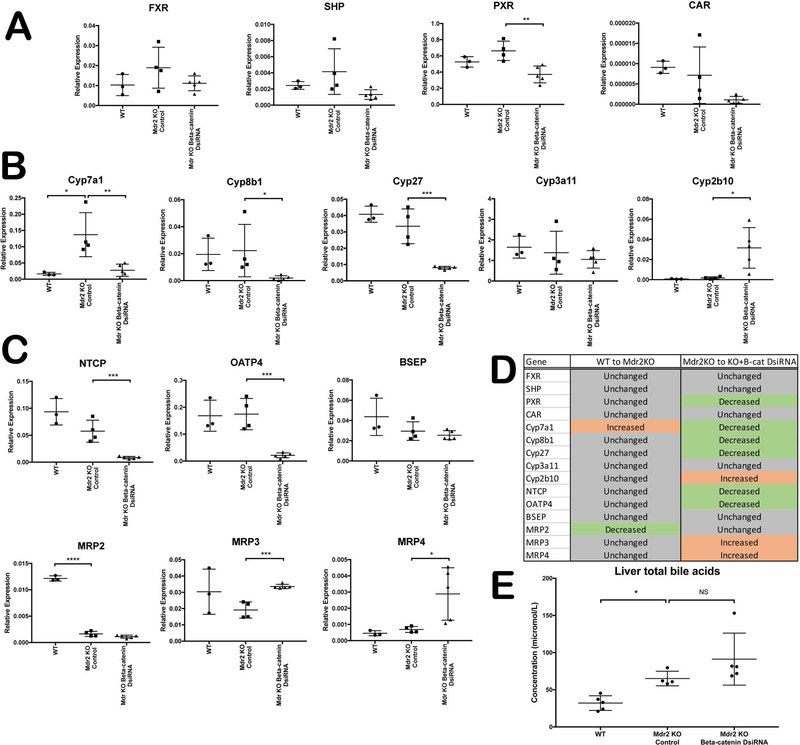
Figure 6: Dysregulation of BA synthesis, metabolism and transport genes in KO/KD liver.
(A) qPCR analysis shows decreased expression of several BA-regulated nuclear receptors in KO/KD liver. (B) Analysis of P450 expression shows that synthesis of BA is suppressed in KO/KD liver, while detoxification is increased. (C) BA uptake is suppressed, and basolateral efflux is increased, in KO/KD liver, as assessed by qPCR. (D) Tabular representation of the qPCR analysis shown in A, B, and C. (E) Levels of hepatic BA are unchanged between KO/KD and KO alone. *p<0.05; **p<0.01; ***p<0.001; ****p<0.0001.

