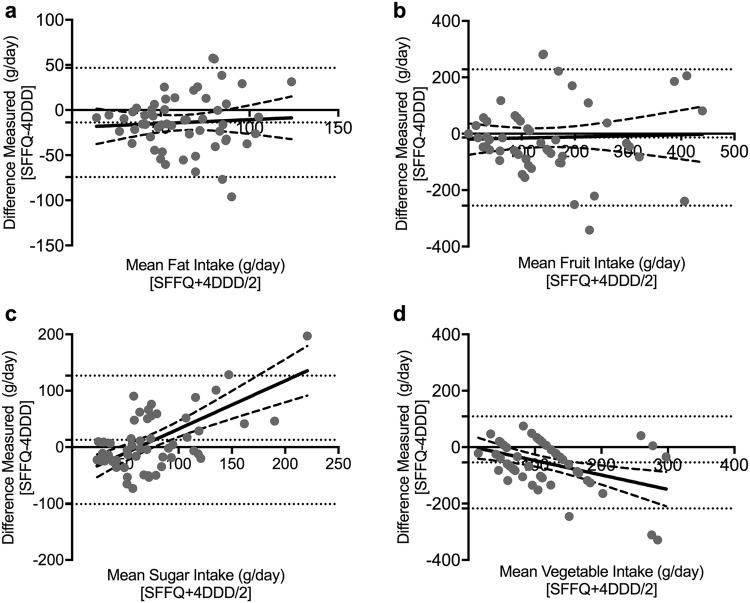
Fig. 1.
Bland Altman plots showing difference vs mean for the SFFQ and 4DDD measurements of: a sugar; b fat; c fruit; and d vegetable intakes. Bias and 95% limits of agreement shown in dotted horizontal lines. Linear regression and 95% confidence intervals are solid line and dashed lines, respectively

