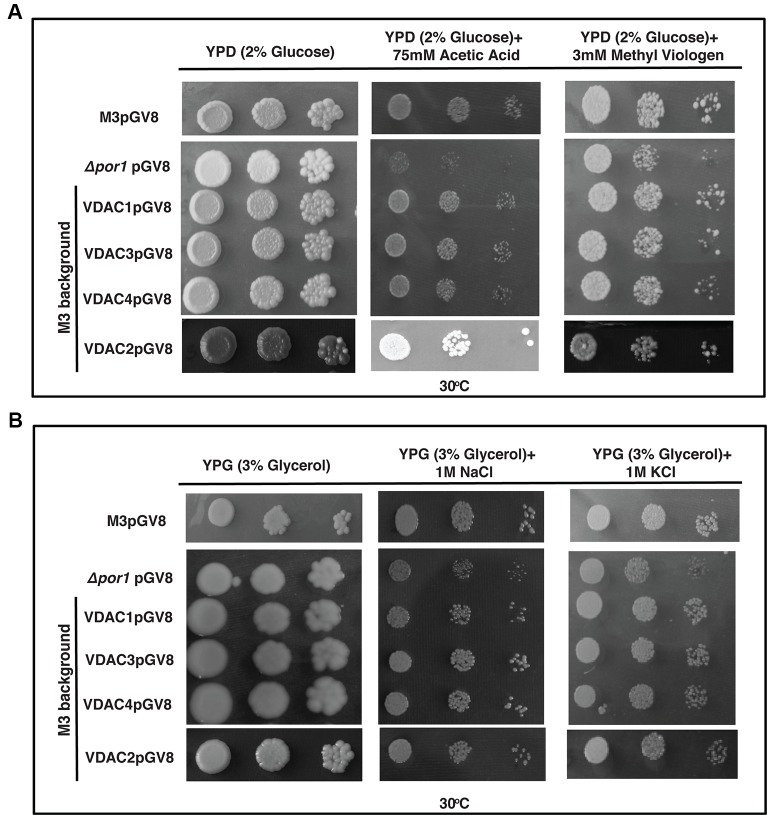
Figure 7.
M3 cells subjected to oxidative and salt stresses. (A) M3 cells transformed with VDACs were spotted on media containing 2% glucose (YPD) with either 75 mM acetic acid or 3mM MV. Plates were incubated at 30°C for 4 days and then documented. None of the genes could affect (enhance/decrease) the growth of M3. (B) M3 cells transformed with different VDACs were spotted on media containing 3% glycerol (YPG) with either 1 M NaCl or 1 M KCl. Plates were incubated at 30°C for 5 days and then documented. The controls in this figure are same as the controls in Figure 3A .

