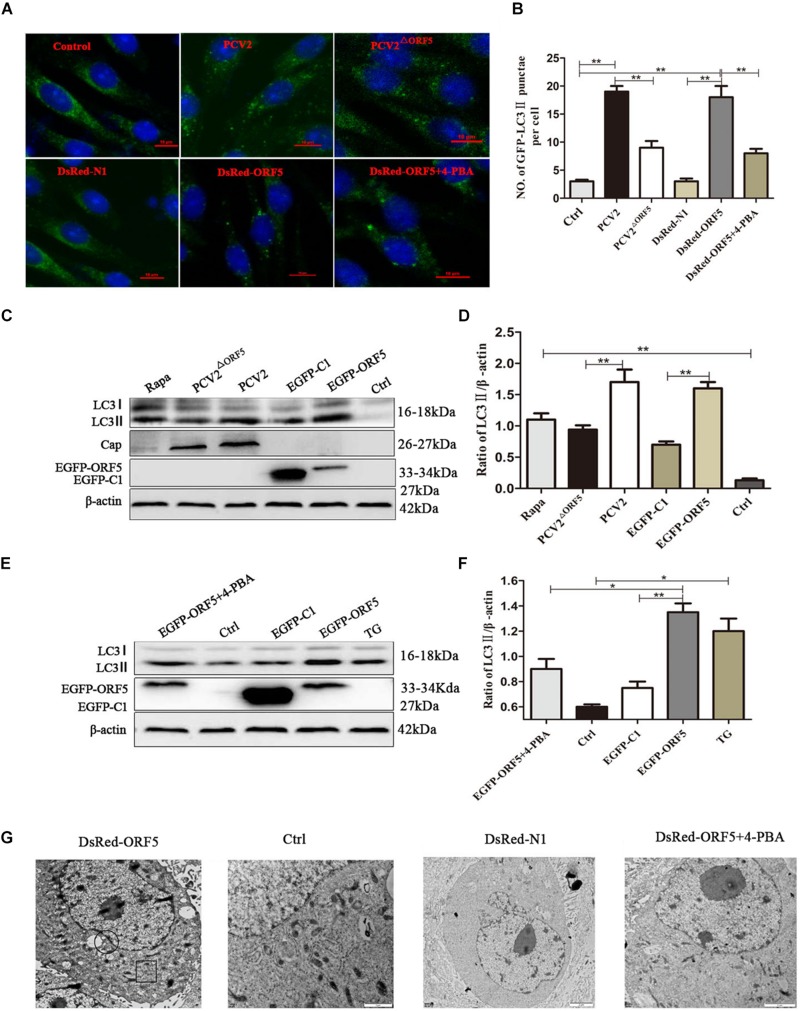
FIGURE 1.
ORF5 induces autophagy in PK-15 cells. (A) Formation of autophagosomes, shown as green punctate in PK-15 cells that were analyzed by fluorescence microscopy (scale bar, 10 μm). (B) Statistical analysis of panel (A), the number of GFP-LC3 points per cell. (C) PCV2 and PCV2ΔORF5 were infected with PK-15 cells, and EGFP-ORF5 was transfected into PK-15 cells. All samples were collected 36 h post-infection or post-transfection. (D) Perform a T-test on the grayscale analysis of the (C), the ratio of LC3 to β-actin. (E) PK-15 cells were pretreated with 4-PBA for 2 h and then transfected with EGFP-ORF5. At 36 h post- transfection, immunoblotting was performed. (F) Perform a T-test on the grayscale analysis of the (E), the ratio of LC3 to β-actin. (G) Electron microscopy of autophagosomes and endoplasmic reticulum after transfection of DsRed-ORF5 plasmids. The black box indicates the autophagosome. The scale bar in DsRed-ORF5 panel is 10 μm. In the rest panels is 2 μm. The endoplasmic reticulum structure in the black circle is swollen and rounded. *p < 0.05, **p < 0.01.

