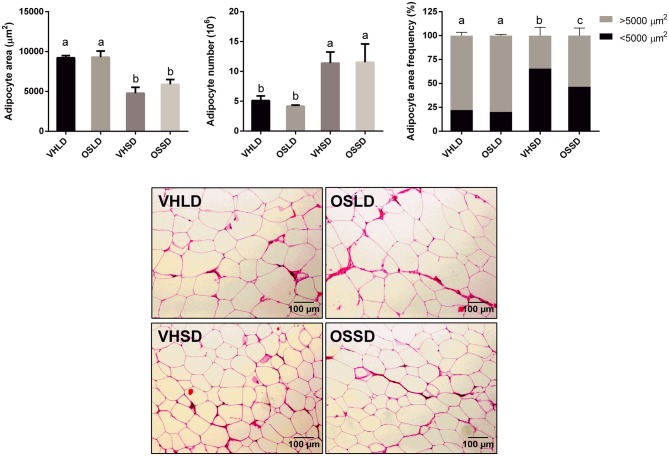
Fig. 1.
Cell number, cell area and adipocyte frequencies of IWAT of Fischer 344 rats supplemented with orange lyophilizate from the southern hemisphere (OS) in short-day (SD) or long-day (LD) photoperiods. For frequencies, adipocytes were distributed in two groups according to their area (< 5000 or > 5000 µm2). Data are presented as the mean ± SEM and statistical significance is analysed by one-way ANOVA (p < 0.05) followed by Duncan’s new multiple range (MRT) post hoc test

