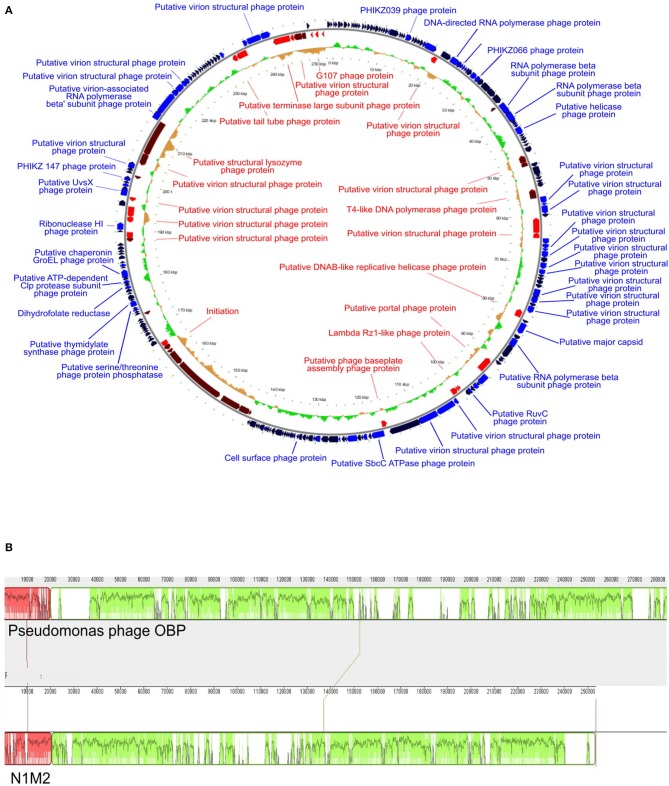
Figure 3.
(A) Genome map of phage N1M2. On the outer ring blue arrows represent genes on the forward strand, red arrows represent genes on the reverse strand, and black arrows represent hypothetical proteins. The inner ring represents GC skew compared to the average GC content of phage N1M2. (B) Mauve alignment of phage N1M2 and Pseudomonas phage OBP.

