


Figure 2.
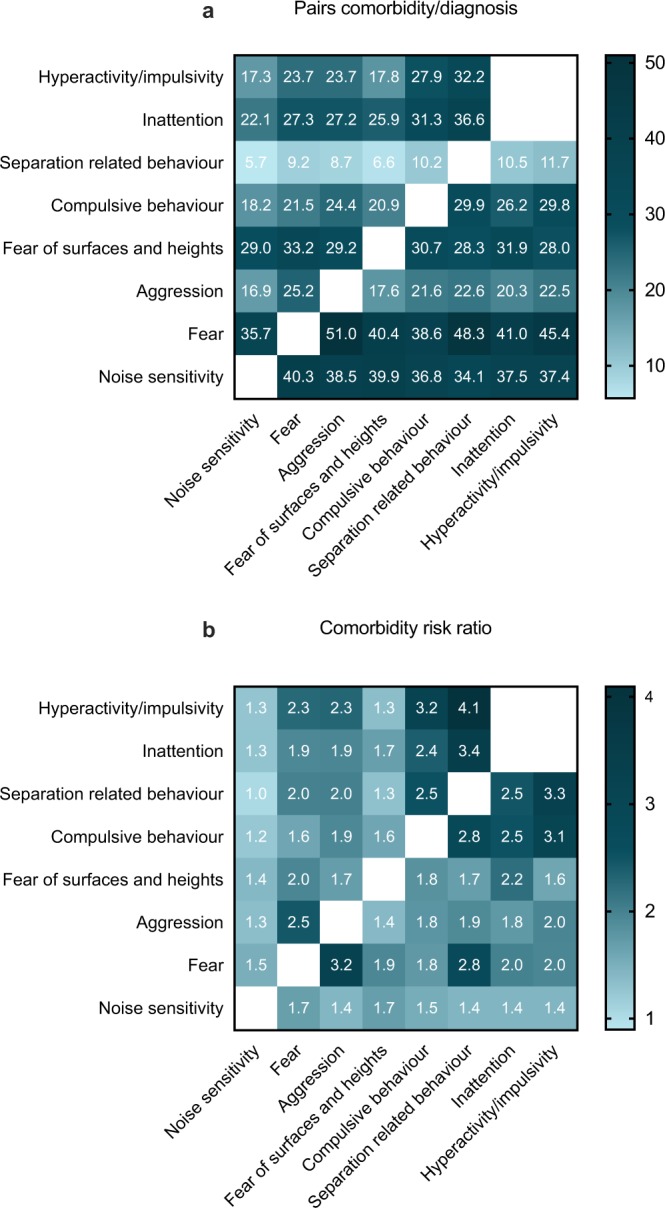
Comorbidity heat maps. Proportion of dogs with pairs of diagnoses using the disorder listed in the column header as the denominator (a) and relative risk (b). (a) Adapted from Goldstein-Piekarski et al.72.
Official websites use .gov
A
.gov website belongs to an official
government organization in the United States.
Secure .gov websites use HTTPS
A lock (
) or https:// means you've safely
connected to the .gov website. Share sensitive
information only on official, secure websites.
Comorbidity heat maps. Proportion of dogs with pairs of diagnoses using the disorder listed in the column header as the denominator (a) and relative risk (b). (a) Adapted from Goldstein-Piekarski et al.72.