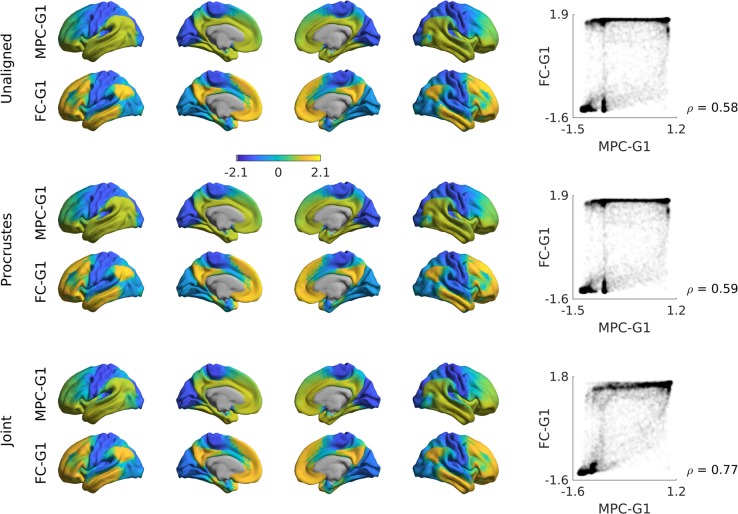
Fig. 4. Comparison of alignment methods across modalities.
Unaligned gradients 1 (top) of MPC and FC were derived using cosine similarity and diffusion mapping. Alignments using Procrustes analyses (middle) and joint embedding (bottom) are also shown. Smoothed scatter plots show correspondence between principal gradient values for FC and MPC across cortical nodes, indicating a moderate increase in Spearman correlation after joint embedding. Gradient values were z-scored before plotting.

