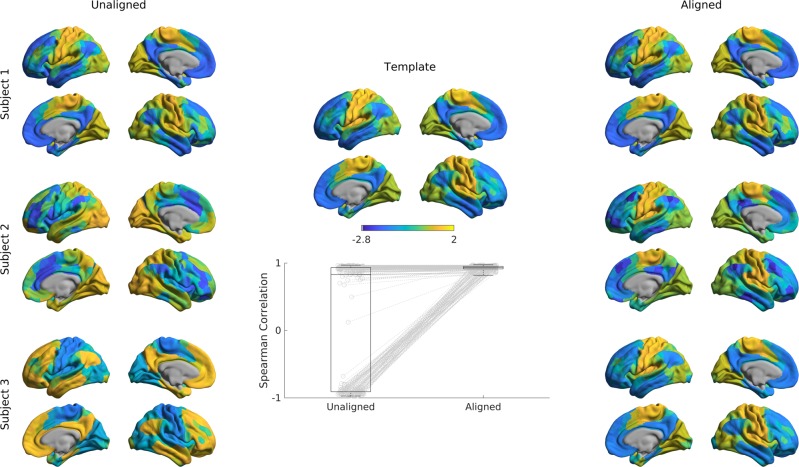
Fig. 6. Alignment of subjects to a template.
Gradients 1 of single subjects computed with the cosine similarity kernel and diffusion mapping manifold (left) were aligned to an out-of-sample template (middle) using Procrustes analysis, creating aligned gradients (right). Box-plot shows the Spearman correlations of each subjects’ gradient 1 values across cortical nodes to the template gradient 1 both before, and after Procrustes alignment. The central line of the box plot denotes the median, the edges denote the 25th and 75th percentiles, and the whiskers extend to the most extreme datapoints.

