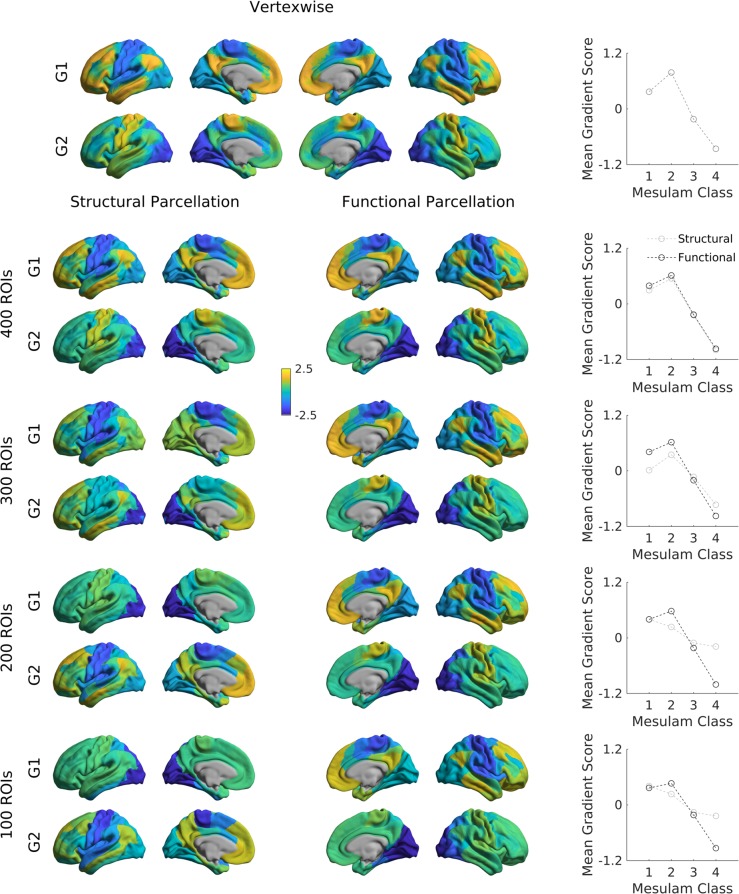
Fig. 8. Functional gradients across spatial scales.
The cortex was subdivided into 100 (first row), 200 (second row), 300 (third row), and 400 (fourth row) regions of interest based on an anatomical (left) and functional (right) parcellation. Displayed are gradients 1 (G1), and 2 (G2), each for one hemisphere only. Line plots show the average gradient score within each Mesulam class for the functional (dark gray) and structural (light gray).

