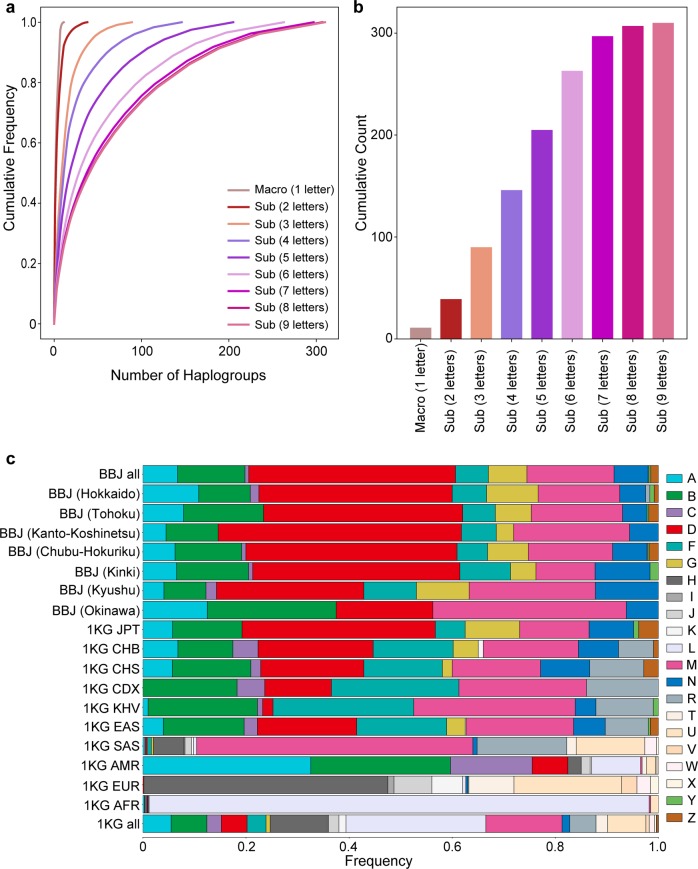
Fig. 1. High-resolution spectra of mtDNA haplogroups in the Japanese population.
The detailed haplogroup distributions based on the Japanese WGS data (n = 1928). a Cumulative frequency spectra of the haplogroups from macrohaplogroup (one letter) to sub-haplogroups (nine letters). b Cumulative counts of the haplogroups from macrohaplogroup (one letter) to sub-haplogroup (nine letters). c Stacked bar plots of the frequencies of the macrohaplogroups within the geographical regions in Japan and subpopulations from 1KG. The geographical regions in Japan are defined as Hokkaido, Tohoku, Kanto-Koshinetsu, Chubu-Hokuriku, Kinki, Kyushu, and Okinawa from northeast to southwest areas of Japan, as described elsewhere42.

