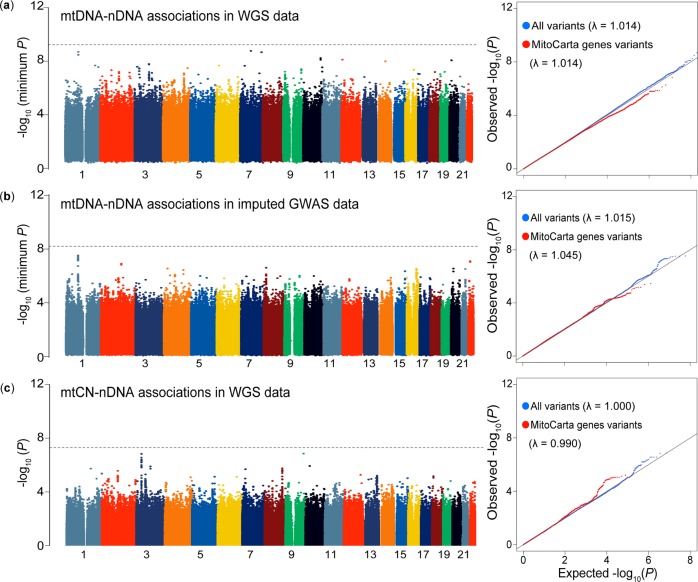
Fig. 4. Genome-wide scan of the mtDNA–nDNA (or mtCN-) genotype associations.
The plotted P-value is the association P-value for each analysis. In each panel, a Manhattan plot and a quantile–quantile (QQ) plot are indicated. The y-axes of the Manhattan plots in a and b indicate −log10(minimum P) at each nDNA variant extracted from the results for all mtDNA variants tested. The horizontal gray lines represent the study-wide significant threshold (P < 5.8 × 10⁻¹⁰, 6.3 × 10⁻⁹, and 5.0 × 10⁻⁸ for a, b, and c, respectively). In the QQ plot, blue dots indicate all the variants and red dots are the variants within ±10k bp of the 1105 mitochondria-related genes in nDNA. a The genome-wide mtDNA–nDNA genotype associations obtained from the WGS data (n = 1928, mtDNA variants = 86 [MAF ≥ 5%], and nDNA variants = 7,124,343 [MAF ≥ 1%]). b The genome-wide mtDNA–nDNA genotype associations obtained from the imputed GWAS data (n = 141,552, mtDNA variants = 8 [MAF ≥ 5%], and nDNA variants = 7,402,102 [Rsq ≥ 0.7 and MAF ≥ 1%]). c The genome-wide mtCN–nDNA associations obtained from the WGS data (n = 1928, nDNA variants = 7,124,343 [MAF ≥ 1%]).

