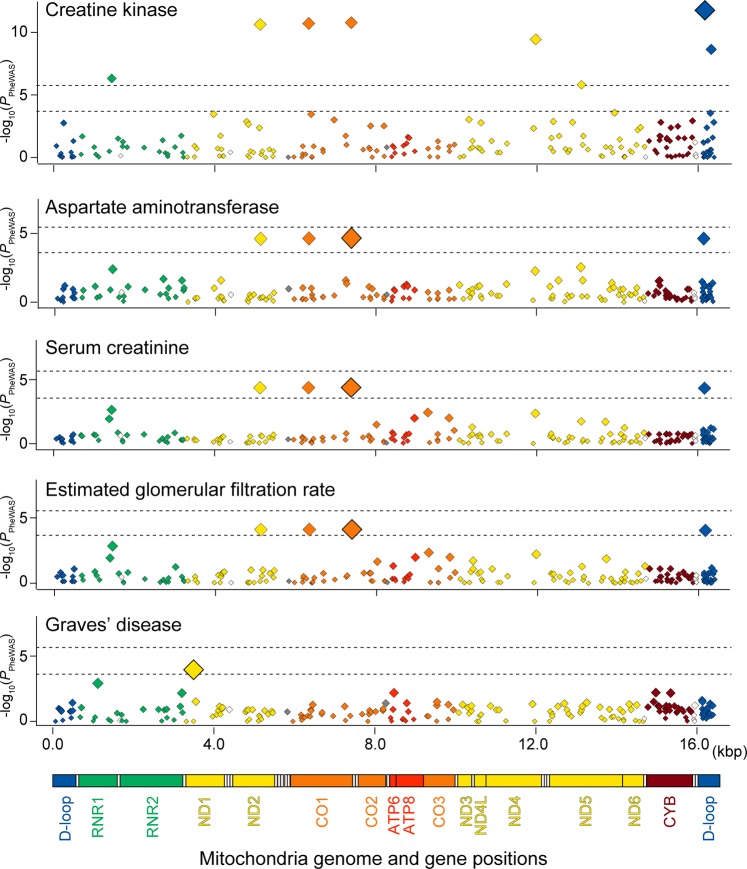
Fig. 5. Mitochondrial regional plots indicating genotype–phenotype associations identified by PheWAS.
Regional association plots of the entire mtDNA illustrating the genotype–phenotype associations identified by the mitochondrial PheWAS in the Japanese population (n = 147,310). Y-axes represent –log10(P) of the associations of the variants and x-axes represent the base pair positions in mtDNA. An upper horizontal bar in each plot represents the study-wide significance threshold of P = 2.5 × 10⁻⁶, considering multiple comparisons of both the numbers of the variants and phenotypes. A lower horizontal bar in each plot represent the study-wide significance threshold of P = 2.4 × 10⁻⁴, considering multiple comparisons of the number of the variants. Mitochondrial gene positions are indicated in the bottom panel.

