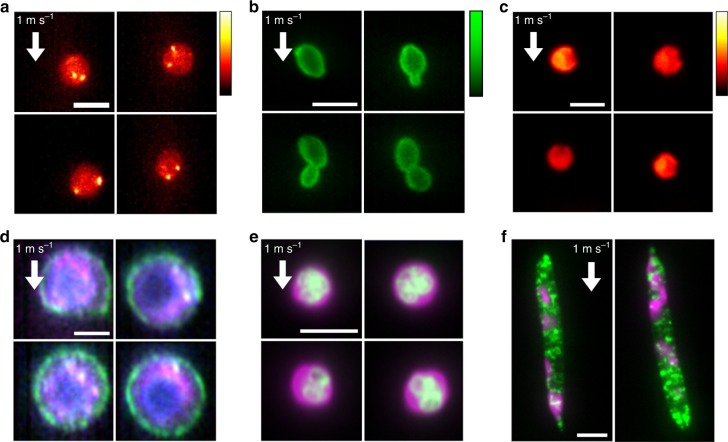
Fig. 3. Fluorescence images of diverse cell types obtained by VIFFI flow cytometry.
All the images were obtained at a flow speed of 1 m s−1. a FISH images of Jurkat cells. Two bright spots (shown in yellow-white) corresponding to two copies of chromosome 8 are evident in each cell. b Fluorescence images of S. cerevisiae whose cell wall was stained by FITC-concanavalin A, showing budding daughter cells from their mother cells. c Autofluorescence images of C. reinhardtii cells, showing their characteristic morphological features (indented elliptical shape at the head). d Three-color fluorescence images of human lung adenocarcinoma cells (PC-9). Magenta: protoporphyrin IX induced by 5-aminolevulinic acid; Green: EpCAM stained by VU-1D9; Blue: nucleus stained by Hoechst 33342. e Two-color fluorescence images of murine neutrophils. Green: nucleus stained by SYTO16; Magenta: cytoplasm stained by CellTracker Red. f Two-color fluorescence images of E. gracilis cells. Green: lipids stained by BODIPY505/515; Magenta: autofluorescence of chlorophyll. Scale bars: 10 µm.

