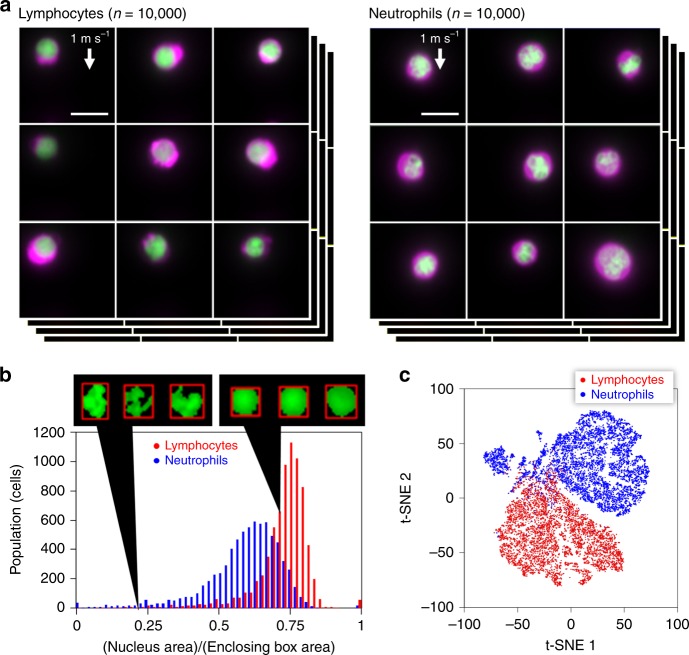
Fig. 4. High-throughput, high-content screening of murine neutrophils, and lymphocytes with VIFFI flow cytometry.
a Libraries of fluorescence images of the cells (n = 10,000 for each group) obtained by VIFFI flow cytometry. The cytoplasm was stained by CellTracker Red (shown in magenta) while the nucleus was stained by SYTO16 (shown in green). Different color scales are used for the fluorescence images of murine neutrophils and lymphocytes for higher image contrast. See Supplementary Figs. 19 and 20 for more images. b Histogram of the cells in the ratio in area between the nucleus and enclosing box (n = 7399 for lymphocytes and n = 7398 for neutrophils). The source data is available in our Source Data file. c t-SNE plot of the cells obtained with 4096 features by VGG-16 (n = 8000 for each group). A sub-type of neutrophils is evident at around (t-SNE 1, t-SNE 2) = (−70, 40). The source data is available in our Source Data file. Scale bars: 10 µm.

